
Figure 9.
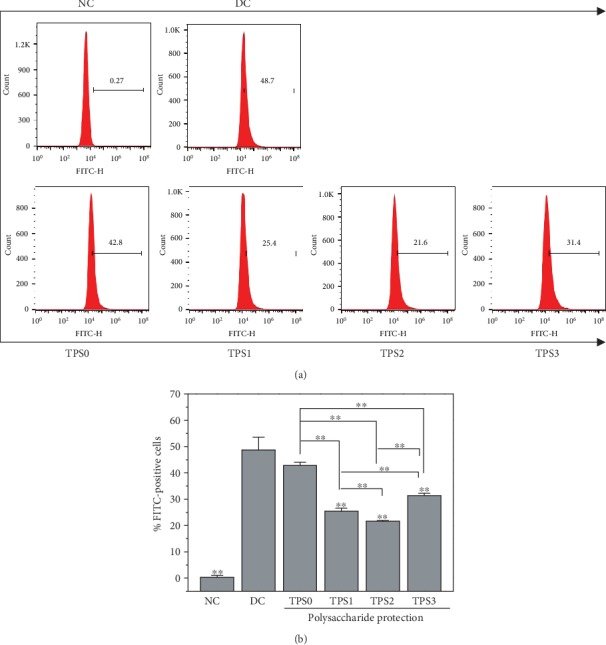
Percentage of cells adhering to nano-COM crystals before and after TPS protection: (a) quantitative histogram; (b) statistical histogram. Experimental conditions are the same as in Figure 1.
Official websites use .gov
A
.gov website belongs to an official
government organization in the United States.
Secure .gov websites use HTTPS
A lock (
) or https:// means you've safely
connected to the .gov website. Share sensitive
information only on official, secure websites.
Percentage of cells adhering to nano-COM crystals before and after TPS protection: (a) quantitative histogram; (b) statistical histogram. Experimental conditions are the same as in Figure 1.