
Figure 10.
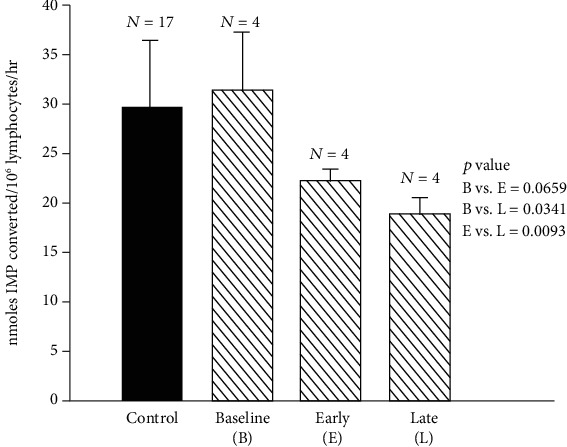
Changes in lymphocyte 5′NT activity during baseline, early zinc deficiency, and late zinc deficiency periods in the experimental model of human zinc deficiency IL 5′NT activity (mean ± SD) nmoles IMP converted/106 lymphocytes/hour) during baseline (B) vs. early deficiency period (E) and late deficiency period (L) were as follows: B vs. E, 31.13 ± 5.56 nmol IMP converted per 106 lymphocytes per hour vs. 21.95 ± 0.92 nmol IMP converted per 106 lymphocytes per hour, p = 0.06; B vs. L, 31.13 ± 5.56 nmol IMP converted per 106 lymphocytes per hour vs. 18.50 ± 1.58 nmol IMP converted per 106 lymphocytes per hour, p = 0.03; E vs. L, 21.95 ± 0.92 nmol IMP converted per 106 lymphocytes per hour vs. 18.50 ± 1.58 nmol IMP converted per 106 lymphocytes per hour, p = 0.009. The values for 5′NT in normal control subjects are also shown (29.5 ± 6.53 nmol IMP converted per 106 lymphocytes per hour) [48].