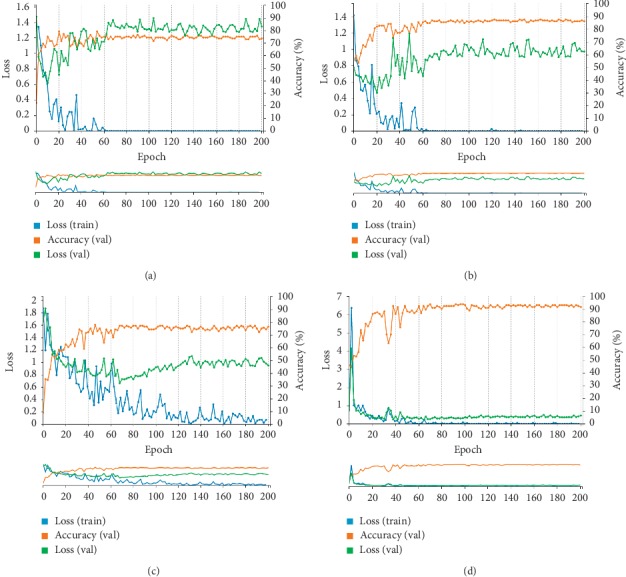
Figure 3.

Training set accuracy and loss curves of the CNNs. The orange lines represent the changes in accuracy of the validation set, the blue lines represent the dynamic loss of the training set, and the green lines represent the dynamic loss of the validation set. (a) Nontreated images classified by type of disease. (b) Nontreated images classified by nature of the disease. (c) Segmented images classified by type of disease. (d) Segmented images classified by nature of the disease.
