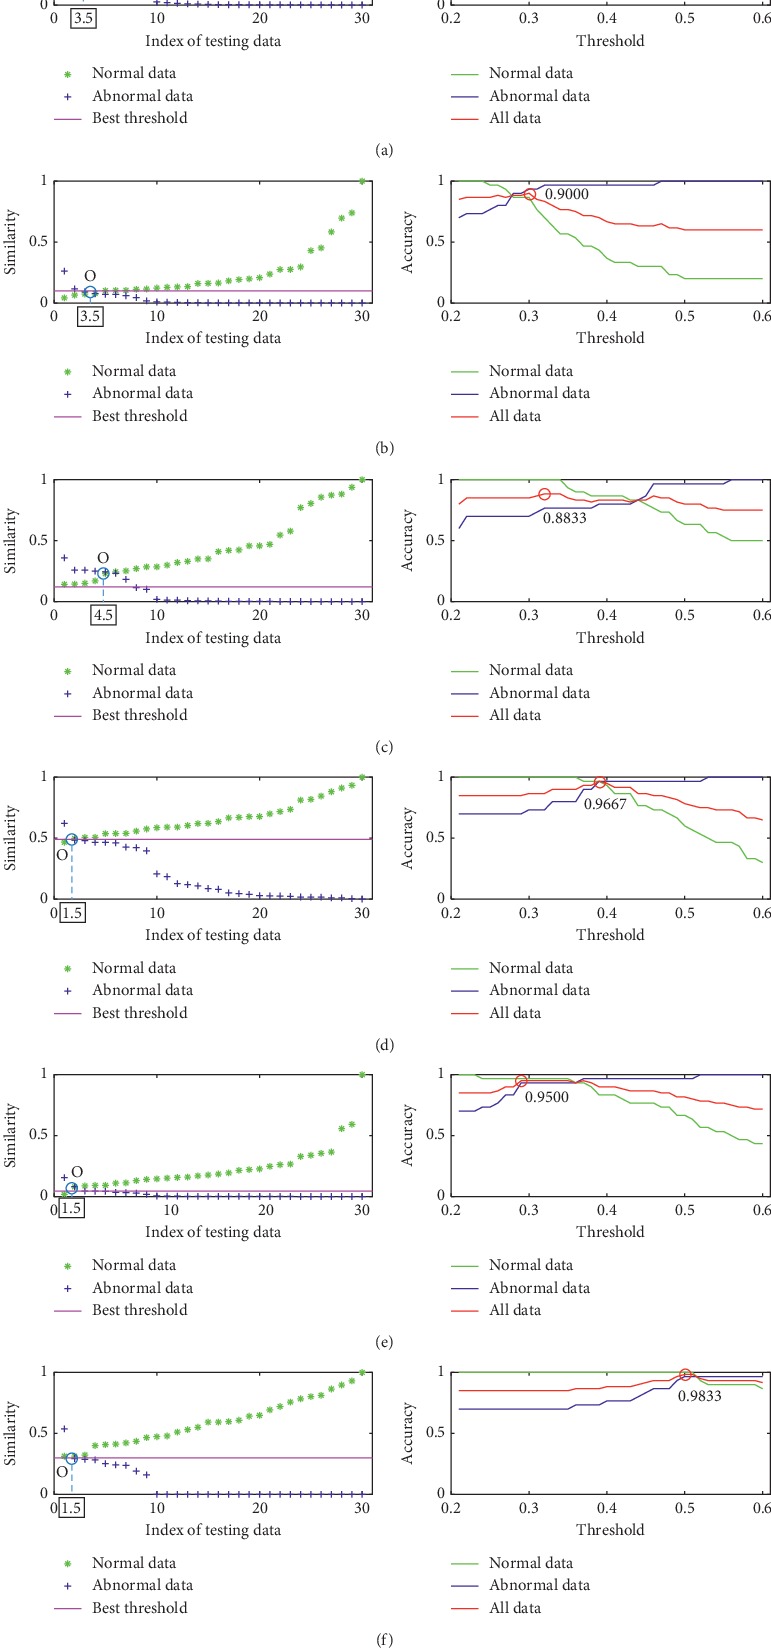
Figure 8.

The detail results of six metrics using the training data of the Bern-Barcelona EEG database. From left to right: the similarity between each piece of data in the training data set and the template set; the accuracy of the metric for the normal training data, abnormal training data, and all training data. Detection result by using (a) ED, (b) PCCD, (c) SKLD, (d) HD, (e) KD, and (f) BD.
