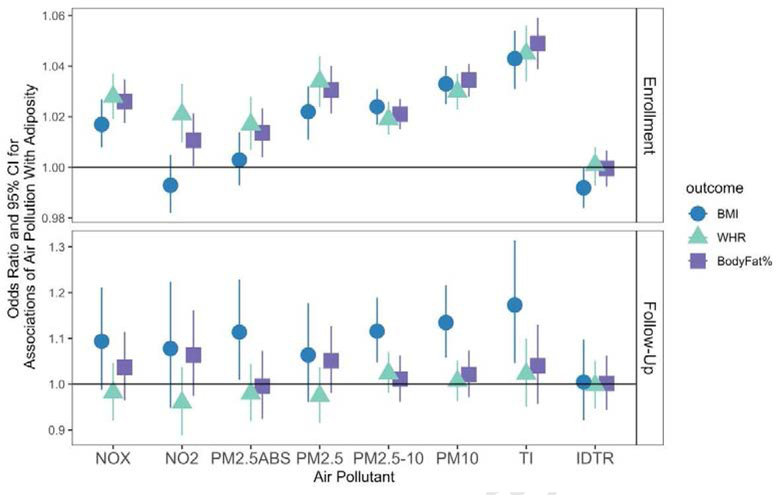
Figure 2. Associations (Odds Ratios & 95% CIs) of Air Pollution With Binary Measures of Adiposity at Enrollment and Follow-Up.
At enrollment, N=473,026 for NOx and NO2 models, and N = 440,193 for PM models. At follow-up, N=19,518 and N= 19,514. BMI indicates BMI-based obesity; WHR indicates WHR-based obesity; and BodyFat% indicates body fat percentage-based obesity. IDTR = log Inverse distance to road; TI = log Traffic Intensity; these were modeled as log variables. Other air pollutants are scaled such that a one unit increase represents a one inter-quartile range increase. Models control for race/ethnicity, age, assessment centre, Townsend Deprivation Index, education, genetic risk score for BMI, noise, and sex. Associations with measures at follow-up are incident associations and exclude participants with the condition at enrollment. Note that the scales are different for enrollment and follow-up, for visualization purposes.

