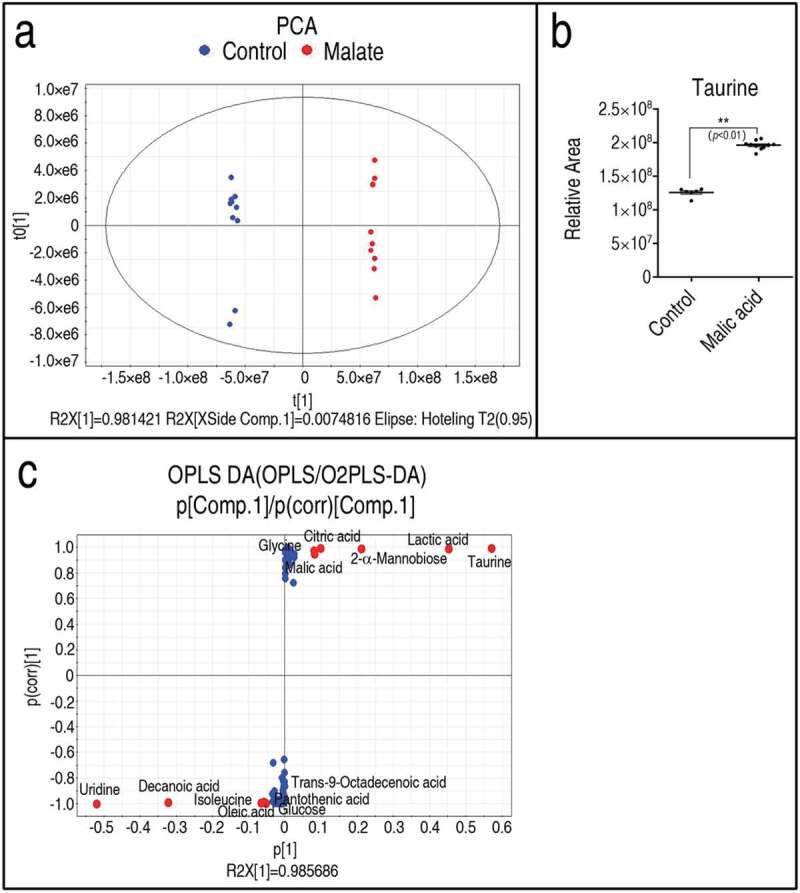
Figure 3.

Identification of crucial metabolites. (a) PCA analysis of malic acid and control groups according to the treatments set. Each dot represents the technical replicate analysis of samples in the plot. T [1] and t0 [1] used in this plot explain 98.14% of the total variance which allows confident interpretation of the variation. (b) S-plot generates from OPLS-DA (R2X = 0.986 R2Y = 0.999, Q2 = 0.997). Predictive component p [1] and correlation p(corr) [1] differentiate malic acid from control. Dot represents metabolites and candidate biomarkers are highlighted in red. (c) Scatter plot of taurine, which comes from data 1a. Results (c) are displayed as mean ± SEM, and significant differences are identified (**p < 0.01) as determined by two-tailed Student’s t-test.
