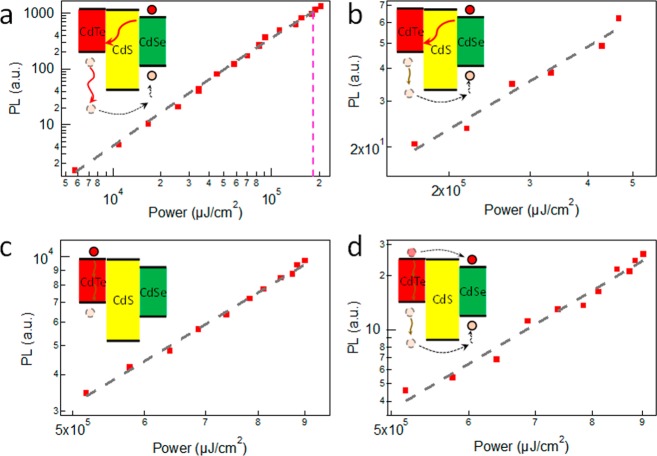
Figure 7.
NPL fluorescence upconversion. (a) 640 nm upconversion excitation of the CdSe core. The data were fitted by a simplified Poisson distribution for the probability to absorb photon pairs plotted as the black dashed line. (b) Pump–probe upconversion excitation of the CdSe core using a 640 nm excitation with fixed excitation power, combined with a second pump at 1064 nm (yielding intraband absorption) with variable power. A fit of the power dependence a·Pexb, with b = 1 is plotted as dashed line. (c) Two-photon excitation of the CdTe crown using 1064 nm excitation, monitored at 620 nm. A fit yields a b = 1.9 power dependence. (d) Fluorescence upconversion, monitored at 510 nm, created by three-photon excitation using λex = 1064 nm. A fit of the power dependence yields b = 3.3.

