Figure 3.

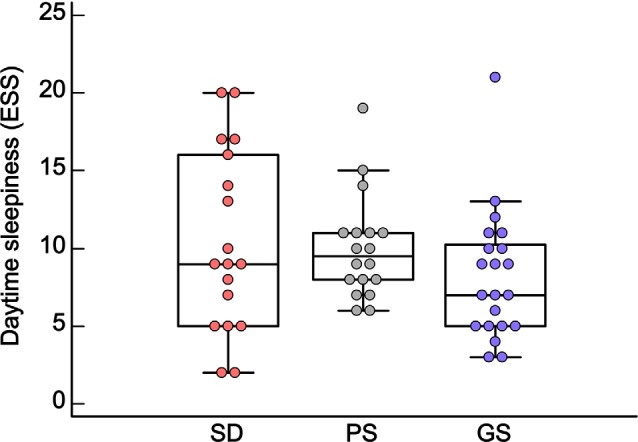
Box plot of daytime sleepiness (median ± Q75% and Q25%), according to the Epworth Sleepiness Scale (ESS), in the sleep disturbance (SD: n = 18), poor sleep (PS: n = 18) and good sleep (GS: n = 21) groups. p ≥ 0.05, Kruskal–Wallis test.

Box plot of daytime sleepiness (median ± Q75% and Q25%), according to the Epworth Sleepiness Scale (ESS), in the sleep disturbance (SD: n = 18), poor sleep (PS: n = 18) and good sleep (GS: n = 21) groups. p ≥ 0.05, Kruskal–Wallis test.