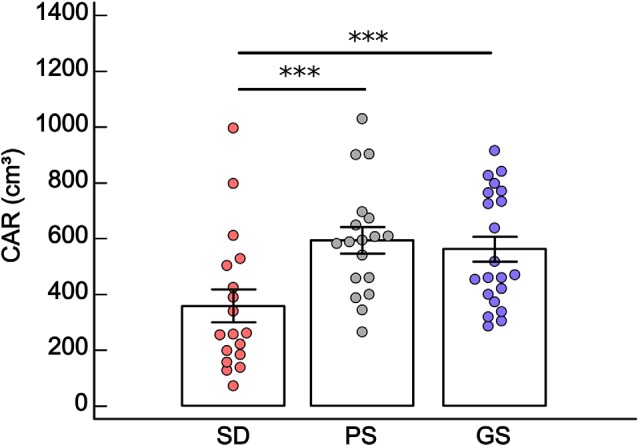
Figure 5.

Mean ± standard error of salivary cortisol awakening response (CAR: cm3) in the sleep disturbance (SD: n = 18), poor sleep (PS: n = 18) and good sleep (GS: n = 21) groups. ***p < 0.001, general linear model (GLM) and Fisher post hoc. Two patients in SD showed close values, one of them being superimposed on the graph.
