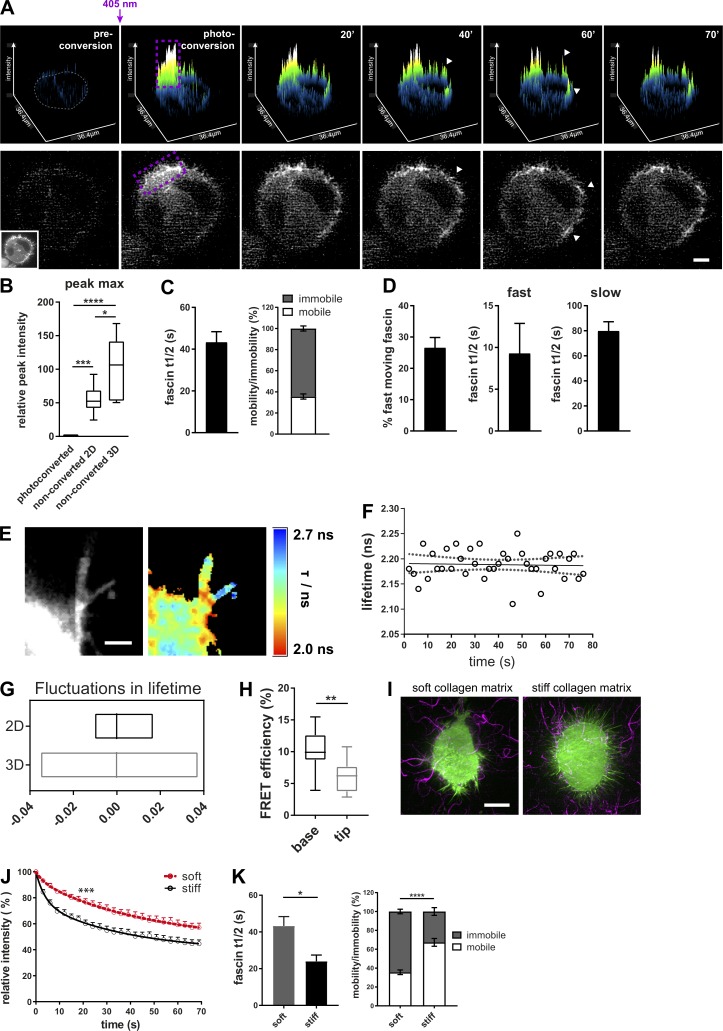
Figure 2.
Fascin dynamics are sensitive to the extracellular mechanical environment. (A) Photoconversion of mEOS2-fascin expressed in cells in 3D collagen matrix imaged at an LLSM. Top panel: Surface plot visualization as shown in Fig. 1. Cell border in preconverted frame is highlighted in gray, and photoconversion region, in purple. Arrowheads depict photoconverted fascin in filopodia outside of conversion area. Bottom panel shows the respective cell and the intensity of the photoconverted channel. Inset picture shows the unconverted cell (green channel). Scale bar = 10 µm. (B) Relative peak intensity values (intensity maxima as highlighted in Fig. 1 B, arrows) of photoconverted and unconverted ROIs of cells in 2D and 3D (photoconverted values were set to 1). 2D and 3D data were normalized to cell size. n = 9 cells for 2D and n = 5 cells for 3D. One-way ANOVA with Bonferroni posttest; *, P ≤ 0.05; ***, P ≤ 0.001; ****, P ≤ 0.0001. (C) Extracted curve-fitting values (fascin t1/2 values and fascin mobility) for monoexponential curves of photoconverted areas. n = 30 cells (ROIs with multiple filopodia per cell). (D) Percentage of fast moving fascin and t1/2 values for fast- and slow-moving fascin were extracted from biexponential fitted curves of photoconverted areas. n = 30 cells (ROIs with multiple filopodia). (E) Interaction of GFP-fascin and RFP-actin of live HeLa cells in 3D collagen matrix measured with multiconfocal FLIM-FRET microscope. Left, intensity image; right, FLIM-FRET data. High interactions are red (low lifetime), whereas low interactions are blue (high lifetime). Scale bar = 2 µm. (F) Fascin–actin interaction measured over time in single filopodium of living cell in 3D collagen matrix at a 3-s frame rate. Plotted are lifetime values over time (circles) with linear regression (solid line) and 95% confidence interval (dotted line). (G) Fluctuation range of fascin–actin interaction measurements by live FLIM-FRET in 2D and 3D. Lowess residuals were calculated as positive or negative residual value of lifetime data at a certain time point in respect to the fitted Lowess curve. Shown are minimum to maximum floating bar graphs for filopodia data of cells in 2D and 3D, and the line represents the median. n = 23 filopodia of two independent experiments. (H) FLIM-FRET measurement of GFP-fascin and RFP-actin in 3D filopodia. Data for base and tip were extracted from single filopodia. n = 14 filopodia (one to two filopodia per cell) of three independent experiments, one-way ANOVA; **, P ≤ 0.01. (I) GFP-fascin–expressing HeLa cells (green) in soft and stiff 3D collagen matrix. Collagen was stained with Cy5 for visualization (magenta). Scale bar = 10 µm. (J) Fascin movement out of filopodia in soft and stiff ECM. Intensity of photoconverted mEOS-fascin in filopodia of HeLa cells embedded in soft (red) and stiff (black) 3D collagen matrix over time. n = 8 cells for soft and n = 13 cells for stiff matrix from one of two independent experiments, two-way ANOVA; ***, P ≤ 0.001. (K) Fascin t1/2 and mobility data of cells in soft and stiff 3D matrix were extracted from monoexponential fitting curves of photoconverted fascin in filopodia (as in J). n = 30 cells for soft and n = 13 cells for stiff; Student’s t test and two-way ANOVA; *, P ≤ 0.05; ****, P ≤ 0.0001.

