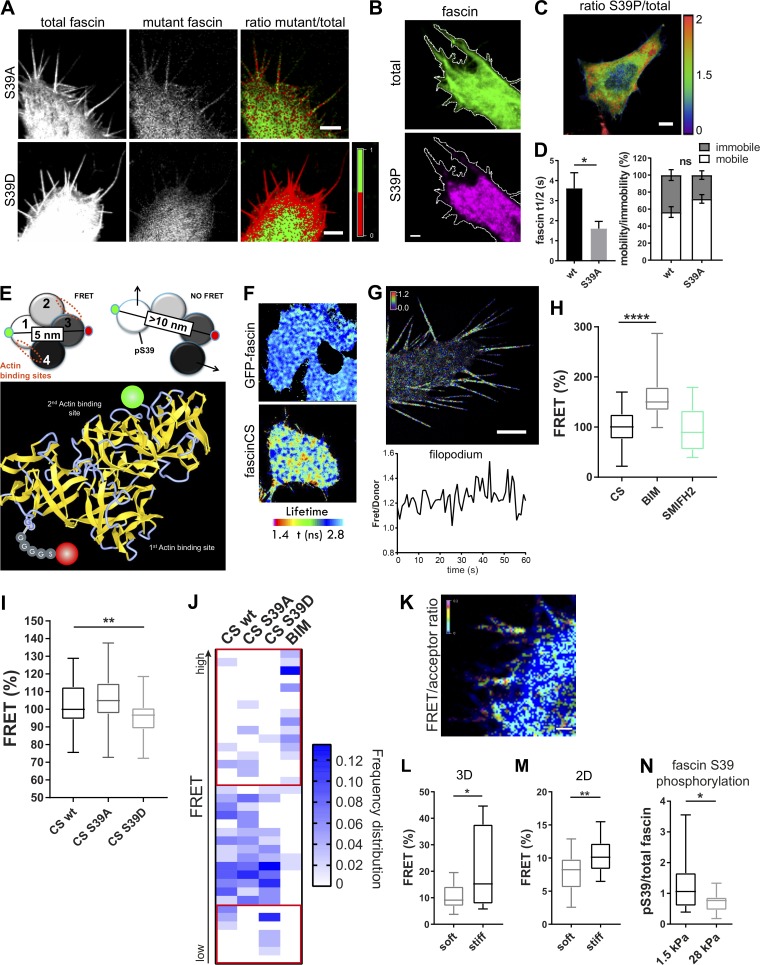
Figure 4.
A biosensor reveals that fascin phosphorylation is mechanosensitive. (A) Fascin knockdown HeLa cells were cotransfected with WT GFP-fascin and either RFP-fascin-S39A (top panel) or RFP-fascin-S39D (bottom panel), and fascin distribution was analyzed by confocal microscopy. Total WT fascin fluorescence is shown on the left, the mutant in the middle, and mutant/total ratio on the right. In the ratio view, a mutant to total fascin ratio of 1:1 (equal distribution) is colored in green; <50% of mutant fascin is colored in red (lack of mutant is red). Scale bar = 5 µm. (B and C) GFP-fascin–expressing cells stained for endogenous pS39-fascin and imaged by confocal microscopy. Representative image (B) of single channels of total fascin (green) and pS39-fascin (magenta) are shown with the respective cell border in white. Scale bar = 5 µm; ratio of pS39/total fascin in the whole cell (C), showing pS39-fascin retention at cell periphery (high pS39-fascin is red, low pS39 is blue), scale bar = 10 µm. (D) Evaluation of fascin-S39A speed and recovery in comparison with WT fascin by FRAP (FRAP curves shown in Fig. S3 F). Statistical analysis of fascin t1/2 and mobility extracted from monoexponential fitting of single curves. n = 7 cells with one ROI per cell and one to two filopodia per ROI; Student’s t test; *, P ≤ 0.05; ns, not significant. (E) Schematic view of CS-fascin in a potential high-FRET and low-FRET conformation (based on crystal structure). Approximate distances of fluorophores (GFP and mScarlet) are indicated (top). Bottom: Ribbon diagram of WT fascin (PDB: 3P53), with actin binding sites and fluorophores on surface exposed loops indicated. (F) FLIM-FRET analysis of CS-fascin in fixed HeLa cells. Top panel shows pseudocolored FLIM data from GFP-fascin only (donor control), and bottom panel shows CS-fascin (donor and acceptor). Scale bar, 5 μm. (G) SIM image of CS-fascin ratiometric view of FRET/donor of one representative live cell. Scale bar = 5 µm. Bottom graph shows fluctuating FRET/donor values for a representative filopodium over time. (H) FRET/donor ratios (FRET %, normalized to mean CS values without treatment) of HeLa cells expressing CS-fascin imaged live on a confocal microscope with and without treatment with PKC inhibitor (BIM) and formin inhibitor (SMIFH2). Shown are data from three independent experiments (n = 40, 53, or 26 cells), one-way ANOVA with Bonferroni posttest; ****, P ≤ 0.0001. (I) FRET/donor ratios of WT, CS-fascin-S39A–, and CS-fascin-S39D–expressing cells (FRET %, normalized to mean CS WT values). Data are from three independent experiments (n = 46, 52, or 52 cells), one-way ANOVA with Bonferroni posttest; **, P ≤ 0.01. (J) Frequency distribution graph of data shown in I showing relative FRET frequency (bin range = 0.8–1.5, bin width = 0.02). Red squares highlight main differences between fascin mutants at the lower and higher FRET value ranges. (K) Representative image of cell expressing CS-fascin and embedded in 3D collagen matrix imaged by LLSM. FRET/acceptor ratio is shown in pseudocolor with high FRET in red/pink and low FRET in blue. Scale bar, 1 μm. (L and M) CS-fascin displays different FRET levels depending on the stiffness of the surrounding substrate. (L) FRET for CS-fascin–expressing cells in soft and stiff 3D matrix (FRET/acceptor). n = 14 cells, Student’s t test; *, P ≤ 0.05. (M) FRET values (FRET/donor) for CS-fascin–expressing HeLa cells on soft and stiff collagen-coated 2D slides (soft: elastically supported surface of 1.5-kPa stiffness, stiff: glass). Data pooled from three independent experiments, with n = 10 cells per experiment. Student’s t test; **, P ≤ 0.01. (N) Fascin pS39 was stained in GFP-fascin–expressing fascin knockdown cells plated on soft and stiff 2D surfaces (1.5 and 28 kPa, respectively). The ratio of pS39 (AF560) and total fascin (GFP) intensities was calculated. Student’s t test; *, P ≤ 0.05, n = 25 and 19 cells for 1.5 and 28 kPa, respectively.

