Figure S1.
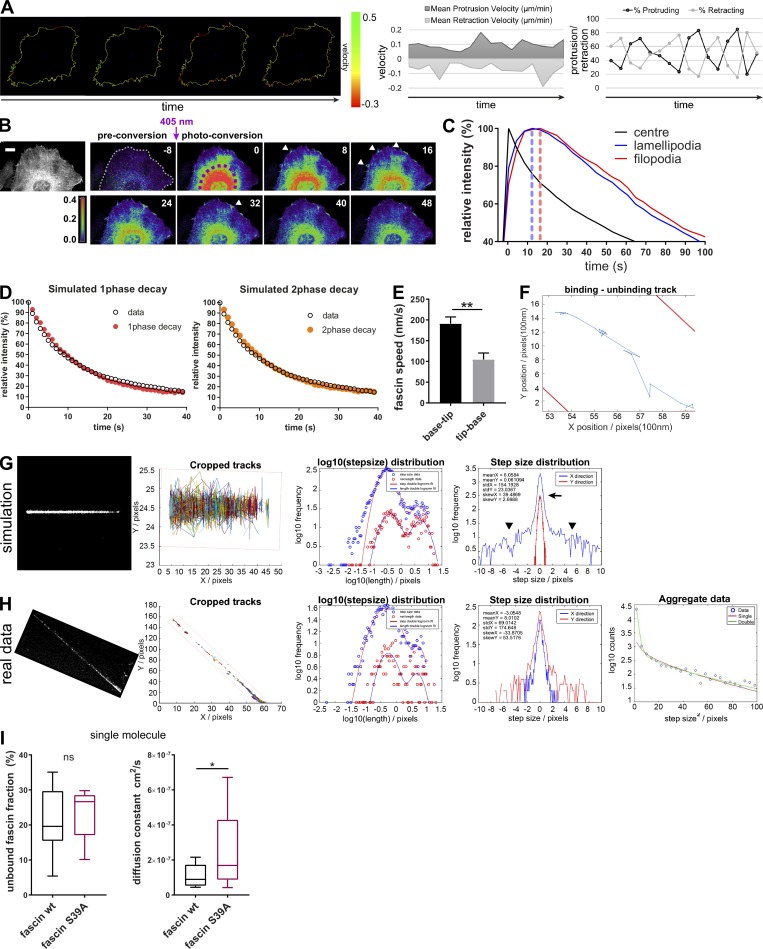
Single-molecule analysis of fascin behavior in filopodia. (A) HeLa cell protrusion and retraction (percentage and velocity) was measured with the open source ImageJ plugin ADAPT. Left image sequence shows protrusion and retraction velocity along the cell border. Scale bar, 10 μm. (B) mEOS2-fascin was photoconverted in the cell center (perinuclear region), and diffusion of mEOS2-fascin was monitored over time. Shown is a representative time-lapse series with preconversion on the left, followed by pseudocolored ratios of converted/nonconverted intensities. Scale bar = 5 µm. (C) Relative intensity values (% of maximum for each ROI) of photoconverted mEOS2-fascin fluorescence measured for the photoconversion area, unconverted lamellipodia and filopodia over time. Peak intensity times are highlighted with dashed lines. Data from one representative experiment are shown. Fascin moved at ∼3 µm/s from the center toward the periphery. (D) Simulation of monoexponential (red) and biexponential (orange) decay curve fitting for fascin movement out of filopodia. For biexponential decay curves, fast moving fascin was estimated at ∼20%. Simulated data (color) were overlaid with real experimental data (black). (E) Kymographs of small region FRAP experiments (as in Fig. 1 E) were analyzed for fascin speed (base to tip movement vs. tip-base movement). Student’s t test; **, P ≤ 0.01. (F) Single-molecule track on one fascin molecule along the filopodia shaft (borders in red) with binding and unbinding behavior. (G) Simulation of single-molecule movement. Cropped tracks show simulated single-molecule tracks along hypothetical filopodium (borders in red). Log10 step-size distribution for a bimodal single molecule behavior. Simulation of step size distribution in X (along filopodia shaft) and Y (perpendicular to filopodia shaft) demonstrates localization precision of the method used, with an error peak ∼0 ± 1 pixel (arrow) and real diffusive motion left and right to the peak (arrowheads). (H) Experimental data for one filopodium showing comparative statistics as in G. Number of tracked molecules was limited as visualized in cropped tracks. Log10 stepsize distribution shows bimodal distribution, and step size distribution graph validates model used (with error peak around XY = 0 and free diffusive motion identified around the peak). As tracks were limited for some filopodia, data from separated filopodia were aggregated and fitted to reduce the variation and extract reliable numbers for diffusion and bound/unbound fractions. (I) Unbound fraction (left) and diffusion constant (right) values for WT and fascin-S39A single molecules extracted from individual filopodia (WT n = 15, S39A n = 18) of three independent experiments. Student’s t test; *, P ≤ 0.05; ns, not significant.

