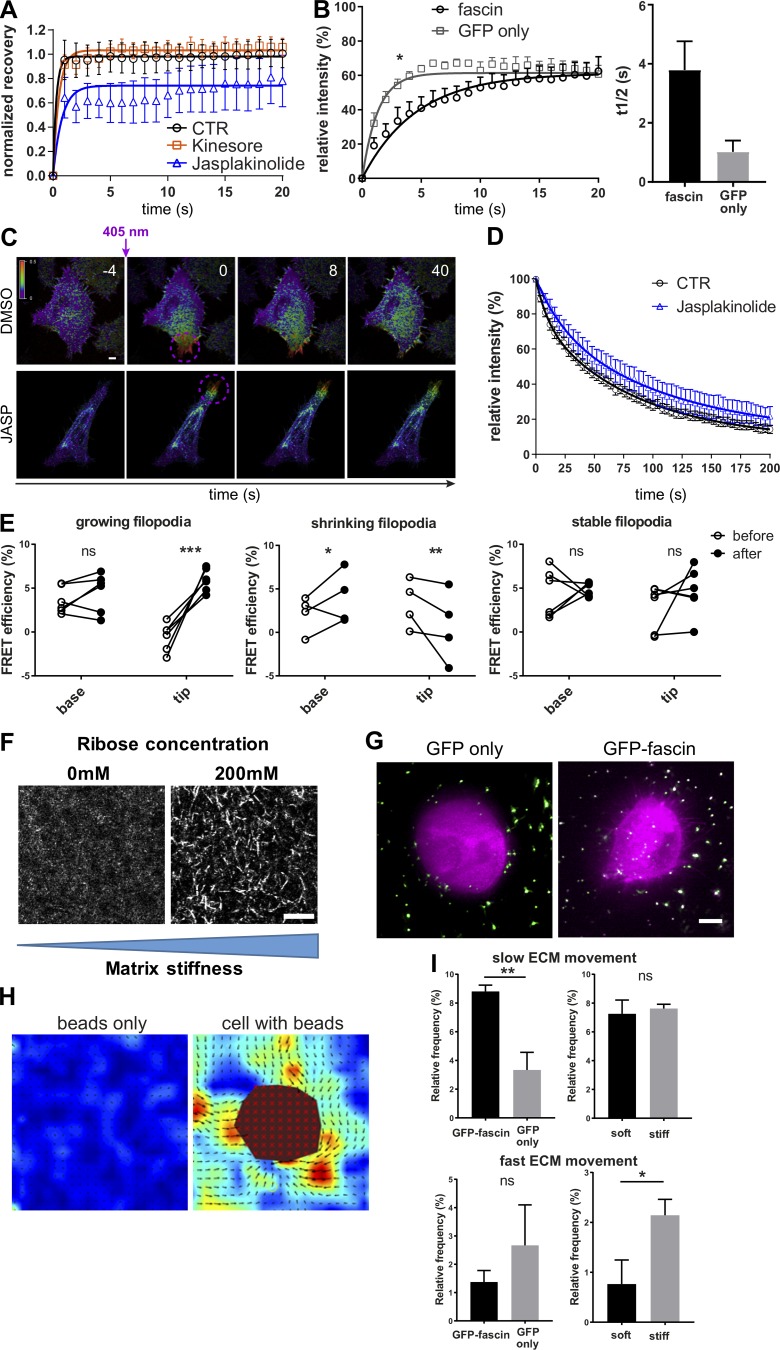
Figure S2.
Fascin dynamics and actin binding are dependent on F-actin turnover, and fascin contributes to local force transmission. (A) Filopodia FRAP on confocal microscope for evaluation of the influence of cytoskeleton on fascin movement without (CTR, black) or with Kinesore (orange) or Jasplakinolide (blue); n = 9 cells for each; data were normalized to the mean value of control filopodia to allow comparison between the four independent experiments. (B) Comparison of FRAP recovery curves of GFP-fascin or GFP alone showed early influx retention of fascin, suggesting active transport or regulated entry and not passive diffusion. FRAP curves were compared by two-way ANOVA, and t1/2 values, using Student’s t test; *, P ≤ 0.05. (C) Photoconversion of filopodia of mEOS2-fascin expressing HeLa cells that were left untreated or treated with Jasplakinolide. Representative time-lapse experiment is shown. Scale bar, 2 μm. (D) Mean relative intensity data of photoconversion experiment (as in B) for control and Jasplakinolide-treated cells. n = 7 cells from one of two independent experiments. (E) Fascin–actin interaction was evaluated over time using live FLIM-FRET in growing, shrinking, and stable filopodia. Graphs show FRET efficiency (calculated relative to GFP only lifetime) at the base and the tip of filopodia at the beginning (before) and at the end (after) of the respective process. Groups were compared using two-way ANOVA followed by a Bonferroni posttest, n = 14 for each condition and representative of three independent experiments; *, P ≤ 0.05; **, P ≤ 0.01; ***, P ≤ 0.001; ns, not significant. (F) Soft and stiff 3D collagen matrix visualized by confocal reflection microscopy. Collagen fibers were bundled and stiffened using 200 mM ribose. Scale bar = 10 µm. (G) HeLa cells expressing GFP only (left) and GFP-fascin in soft 3D collagen matrix with embedded 200-nm beads. Images were captured using LLSM. Scale bar = 5 µm. (H) Analysis of beads only or cells with beads in 3D ECM using PIVlab identifies pulling and pushing forces exerted by the cell on the ECM. Matrix deformation is pseudocolored depending on matrix velocity. Vector arrows indicate the direction of matrix movement, and the size corresponds to the velocity magnitude. The cell body is excluded in the analysis (red mask). Scale bar, 5 μm. (I) Velocity data were separated into slow (1–1.5 µm/s, top panel) and fast (2–2.5 µm/s, bottom panel) ECM movement, and percentages are shown on bar graphs for GFP only and GFP-fascin–expressing cells in soft matrix (left) and GFP-fascin–expressing cells in soft and stiff matrix (right). n = 15 for each condition and representative of three independent experiments; *, P ≤ 0.05; **, P ≤ 0.01.

