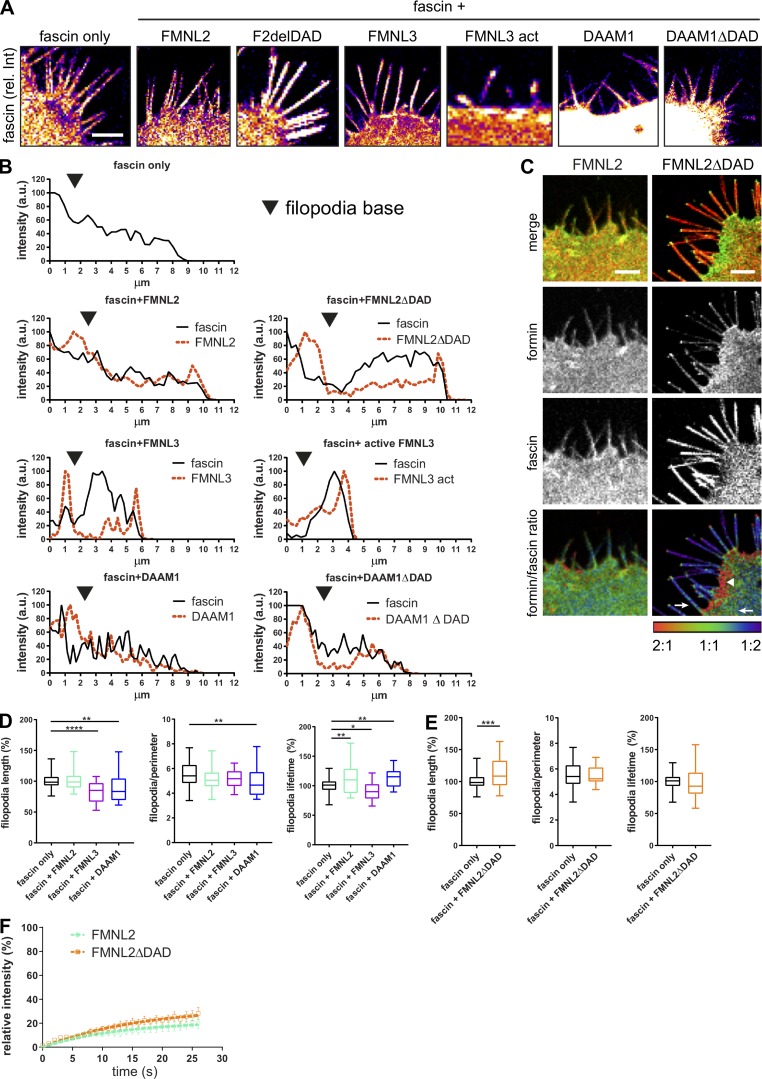
Figure S5.
WT and active FMNL2, FMNL3, and DAAM1 alter fascin distribution at the cell periphery. (A) Fascin distribution was evaluated with and without overexpression of WT and active FMNL2, FMNL3, and DAAM1 using a confocal microscope. Fluorescence intensity values of fascin are shown in pseudocolor to highlight high (white) and low (purple) intensity. Scale bar = 5 µm. (B) Line scans along filopodia in HeLa cells expressing RFP-fascin only (upper panel) or RFP-fascin with coexpression of WT and active FMNL2 (second panel), FMNL3 (third panel), and DAAM1 (fourth panel). Intensity plots versus micrometers show the intensity in arbitrary units for fascin (black, solid line) and the respective formin (red, dashed line) for comparison. (C) Colocalization analysis of FMNL2 (WT and active form, second panel) and fascin (third panel) in HeLa cells upon overexpression of formins. Top panel, merged image; bottom panel, formin/fascin ratio; areas of higher abundance of formin and lower abundance of fascin illustrated in red (2:1 ratio), colocalization in green (1:1 ratio), and high abundance of fascin with low formin in blue (1:2 ratio). Images show high colocalization of FMNL2 and fascin throughout the cell and filopodia and more specific colocalization of active FMNL2ΔDAD with fascin at the filopodia base and a few microns into the cytoplasm (arrow), whereas fascin appears excluded from the lamellipodium close to the plasma membrane (arrowhead). Scale bar = 5 µm. (D and E) Filopodia length (normalized to fascin only), coverage (relative filopodia no/perimeter), and lifetime (normalized to fascin only) was evaluated after overexpression of FMNL2, FMNL3, and DAAM1 (D) and after overexpression of active FMNL2 (FMNLΔDAD; E). One-way ANOVA with uncorrected Fisher posttest or Student’s t test, data from three or more experiments are shown; *, P ≤ 0.05; **, P ≤ 0.01; ***, P ≤ 0.001; ****, P ≤ 0.0001. (F) Filopodia FRAP of GFP-FMNL2– and active GFP-FMNL2ΔDAD–expressing cells with recovery intensities plotted over time. n = 9 cells from one of three independent experiments.

