Figure 2.
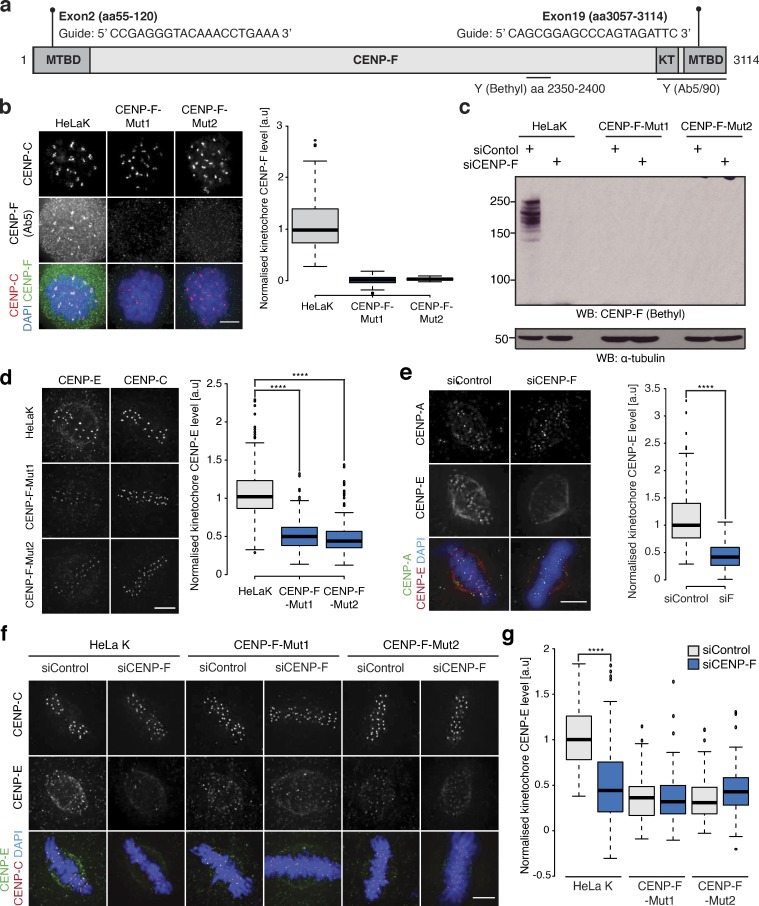
CENP-F CRISPR mutants phenocopy CENP-F RNAi. (a) Schematic showing the CRISPR guide targets and antibody epitopes in CENP-F. (b) Left: Immunofluorescence microscopy images of HeLa-K, CENP-F-Mut1, and CENP-F-Mut2 cells arrested in 330 nM nocodazole for 16 h and stained with antibodies against CENP-C and CENP-F (Ab5). Scale bar, 5 µm. Right: Quantification of kinetochore CENP-F(Ab5) intensity relative to CENP-C in HeLa-K, CENP-F-Mut1, and CENP-F-Mut2 cells arrested in 330 nM nocodazole for 16 h. (c) Immunoblot of liquid-N2 extracts collected from HeLa-K, CENP-F-Mut1, and CENP-F-Mut2 cells treated with either control or CENP-F siRNA and arrested in 330 nM nocodazole for 16 h. The membrane was probed with antibodies against CENP-F(Bethyl) and α-tubulin. (d) Left: Immunofluorescence microscopy images of HeLa-K, CENP-F-Mut1, and CENP-F-Mut2 cells stained with DAPI and antibodies against CENP-E and CENP-C. Scale bar, 5 µm. Right: Quantification of kinetochore CENP-E intensity relative to CENP-C in HeLa-K, CENP-F-Mut1, and CENP-F-Mut2 cells. (e) Left: Immunofluorescence microscopy images of HeLa-K cells treated with either control or CENP-F siRNA and stained with DAPI and antibodies against CENP-E and CENP-A. Scale bar, 5 µm. Right: Quantification of kinetochore CENP-E intensity relative to CENP-A in cells treated with either control or CENP-F siRNA. (f) Immunofluorescence microscopy images of HeLa-K, CENP-F-Mut1, and CENP-F-Mut2 cells treated with either control or CENP-F siRNA and stained with DAPI and antibodies against CENP-E and CENP-C. Scale bar, 5 µm. (g) Quantification of kinetochore CENP-E level relative to CENP-C in HeLa-K, CENP-F-Mut1, and CENP-F-Mut2 cells treated with control or CENP-F siRNA. In b, d, e, and g, boxes depict the median and first and third quartiles, and whiskers represent Q1 and Q3 ± 1.5× interquartile range. ****, P < 0.0001.

