Figure 3.
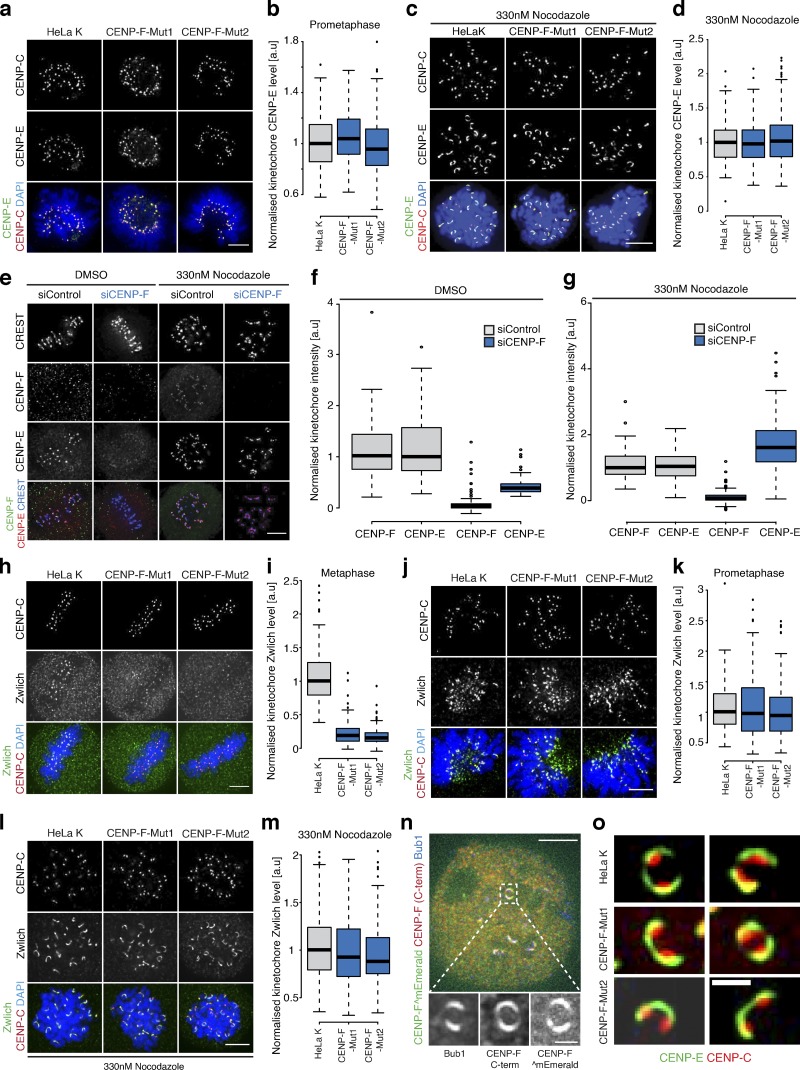
CENP-F controls corona localization in a microtubule-dependent manner. (a) Immunofluorescence microscopy images of early prometaphase HeLa-K, CNP-F-Mut1, and CENP-F-Mut2 cells stained with DAPI and antibodies against CENP-C and CENP-E. Scale bar, 5 µm. (b) Quantification of kinetochore CENP-E intensity relative to CENP-C in early prometaphase HeLa-K, CENP-F-Mut1, and CENP-F-Mut2 cells. (c) Immunofluorescence microscopy images of HeLa-K, CENP-F-Mut1, and CENP-Mut2 treated with 330 nM nocodazole for 16 h and stained with DAPI and antibodies against CENP-C and CENP-E. Scale bar, 5 µm. (d) Quantification of kinetochore CENP-E intensities relative to CENP-C in HeLa-K, CENP-F-Mut1, and CENP-Mut2 treated with 330 nM nocodazole for 16 h. (e) Immunofluorescence microscopy images of HeLa-K cells treated with control or CENP-F siRNA, incubated with DMSO or 330 nM nocodazole for 16 h and stained with DAPI, CREST antisera and antibodies against CENP-E and CENP-F. Scale bar, 5 µm. The CREST display intensities are not comparable between DMSO and nocodazole conditions. (f) Quantification of kinetochore CENP-E and CENP-F levels relative to CREST in HeLa-K cells treated with control or CENP-F siRNA and incubated with DMSO for 16 h. (g) Quantification of kinetochore CENP-E and CENP-F levels relative to CREST in HeLa-K cells treated with control or CENP-F siRNA and incubated with 330 nM nocodazole for 16 h. (h) Immunofluorescence microscopy images of metaphase HeLa-K, CENP-F-Mut1, and CENP-F-Mut2 cells stained with antibodies against CENP-C and Zwlich. Scale bar, 5 µm. (i) Quantification of kinetochore Zwlich level relative to CENP-C at kinetochores in metaphase HeLa-K, CENP-F-Mut1, and CENP-F-Mut2 cells. (j) Immunofluorescence microscopy images of early prometaphase HeLa-K, CENP-F-Mut1, and CENP-F-Mut2 cells stained with antibodies against CENP-C and Zwlich. Scale bar, 5 µm. (k) Quantification of kinetochore Zwlich intensities relative to CENP-C in prometaphase HeLa-K, CENP-F-Mut1, and CENP-F-Mut2 cells. (l) Immunofluorescence microscopy images of HeLa-K, CENP-F-Mut1, and CENP-Mut2 cells treated with 330 nM nocodazole for 16 h and stained with antibodies against CENP-C and Zwlich. Scale bar, 5 µm. (m) Quantification of kinetochore Zwlich intensities relative to CENP-C in HeLa-K, CENP-F-Mut1, and CENP-Mut2 cells treated with 330 nM nocodazole for 16 h. (n) Immunofluorescence microscopy images of HeLa-K cells transfected with CENP-F^mEmerald, arrested in 330 nM nocodazole for 16 h, and stained with antibodies against Bub1 and CENP-F C-terminus (Ab5). Insets show a zoom of an expanded kinetochore. Scale bars, 5 µm (upper); 1 µm (lower). (o) Immunofluorescence microscopy images of CENP-E crescents in HeLa-K, CENP-F-Mut1, and CENP-F-Mut2 cells arrested in 330 nM nocodazole for 16 h. Scale bar, 1µm. In b, d, f, g, i, k, and m, boxes depict the median and first and third quartiles, and whiskers represent Q1 and Q3 ± 1.5× interquartile range.

