Figure 8.
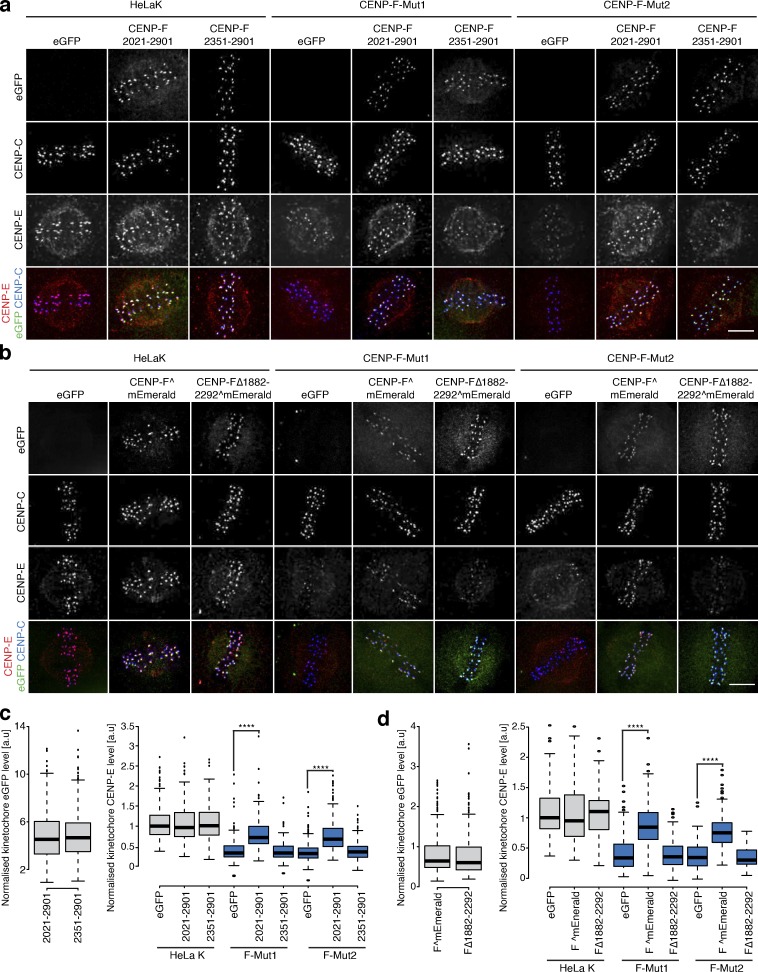
CENP-F-Nde1 controls corona stripping by dynein in untreated cells. (a) Immunofluorescence microscopy images of HeLa-K, CENP-F-Mut1, and CENP-F-Mut2 cells transfected with an empty vector, eGFP-CENP-F(2021–2901), or eGFP-CENP-F(2351–2901) and stained with DAPI and antibodies against CENP-E and CENP-C. Scale bar, 5 µm. (b) Immunofluorescence microscopy images of HeLa-K, CENP-F-Mut1, and CENP-F-Mut2 cells transfected with an empty vector, CENP-F^mEmerald, or CENP-FΔ1882–2292^mEmerald and stained with DAPI and antibodies against CENP-E and CENP-C. Scale bar, 5 µm. (c) Left: Quantification of kinetochore eGFP intensities minus background in cells expressing eGFP-CENP-F(2021–2901) or eGFP-CENP-F(2351–2901). Right: Quantification of kinetochore CENP-E intensities relative to CENP-C in HeLa-K, CENP-F-Mut1, and CENP-F-Mut2 cells transfected with an empty vector, eGFP-CENP-F(2021–2901), or eGFP-CENP-F(2351–2901). (d) Left: Quantification of kinetochore eGFP intensities minus background in cells expressing CENP-F^mEmerald or CENP-FΔ1882–2292^mEmerald. Right: Quantification of kinetochore CENP-E intensities relative to CENP-C in HeLa-K, CENP-F-Mut1, and CENP-F-Mut2 cells transfected with an empty vector, CENP-F^mEmerald, or CENP-FΔ1882–2292^mEmerald. In c and d, boxes depict the median and first and third quartiles, and whiskers represent Q1 and Q3 ± 1.5× interquartile range. ****, P < 0.0001.

