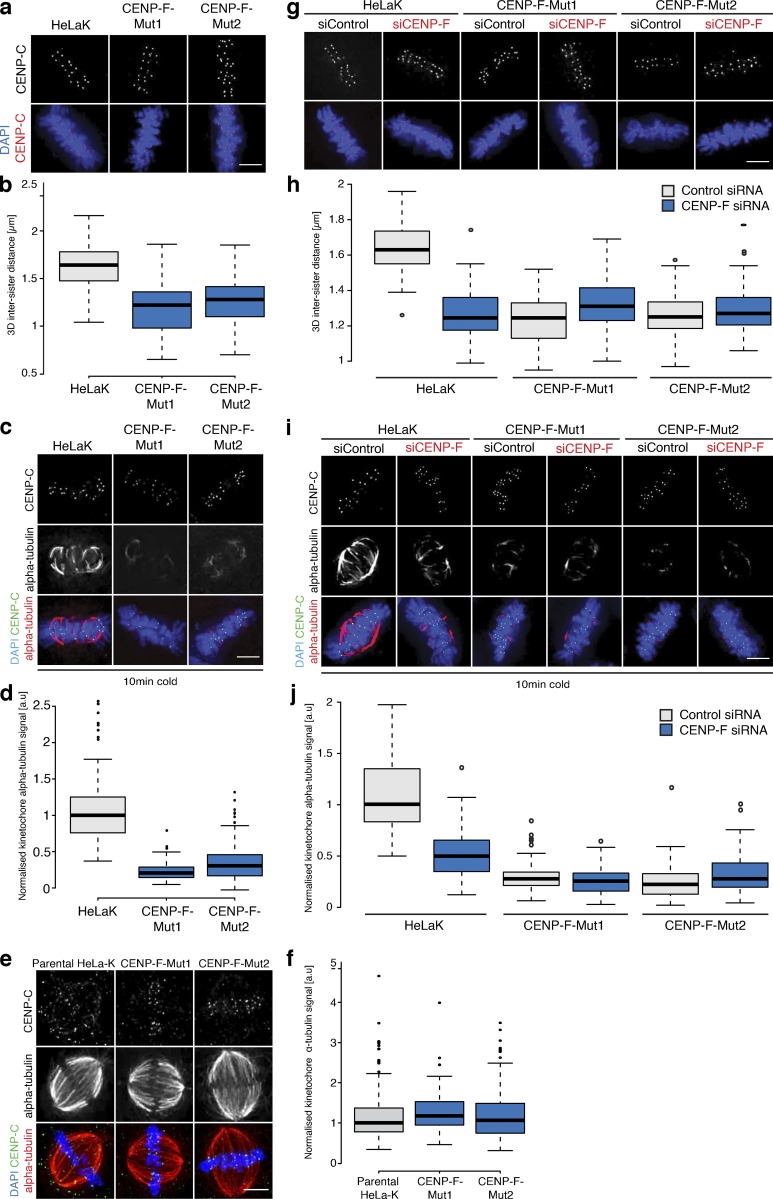
Figure S3.
CENP-F CRISPR mutants phenocopy CENP-F siRNA. (a) Immunofluorescence microscopy images of HeLa-K, CENP-F-Mut1, and CENP-F-Mut2 cells stained with DAPI and an antibody against CENP-C. Scale bar, 5 µm. (b) Quantification of the CENP-C–based intersister distance in HeLa-K, CENP-F-Mut1, and CENP-F-Mut2 cells. (c) Immunofluorescence microscopy images of HeLa-K, CENP-F-Mut1, and CENP-F-Mut2 cells incubated on ice for 10 min before being stained with DAPI and antibodies against CENP-C and α-tubulin. Scale bar, 5 µm. (d) Quantification of kinetochore proximal α-tubulin intensity in HeLa-K, CENP-F-Mut1, and CENP-F-Mut2 cells incubated on ice for 10 min. (e) Immunofluorescence microscopy images of untreated and glutaraldehyde-fixed HeLa-K, CENP-F-Mut1, or CENP-F-Mut2 cells stained with DAPI and antibodies against α-tubulin and CENP-C. Scale bar, 5 µm. (f) Quantification of kinetochore proximal α-tubulin intensity in untreated and glutaraldehyde-fixed HeLa-K, CENP-F-Mut1, or CENP-F-Mut2 cells. (g) Immunofluorescence microscopy images of HeLa-K, CENP-F-Mut1, and CENP-F-Mut2 cells treated with either control or CENP-F siRNA and stained with DAPI and an antibody against CENP-C. Scale bar, 5 µm. (h) Quantification of the CENP-C–based intersister distance in HeLa-K, CENP-FMut1, and CENP-F-Mut2 cells treated with either control or CENP-F siRNA. (i) Immunofluorescence microscopy images of HeLa-K, CENP-F-Mut1, and CENP-F-Mut2 cells treated with control or CENP-F siRNA, incubated on ice for 10 min, and stained with DAPI and antibodies against CENP-C and α-tubulin. Scale bar, 5 µm. (j) Quantification of kinetochore proximal α-tubulin intensity in HeLa-K, CENP-F-Mut1, and CENP-F-Mut2 cells treated with control or CENP-F siRNA and incubated on ice for 10 min. In b, d, f, h, and j, boxes depict the median and first and third quartiles, and whiskers represent Q1 and Q3 ± 1.5× interquartile range.

