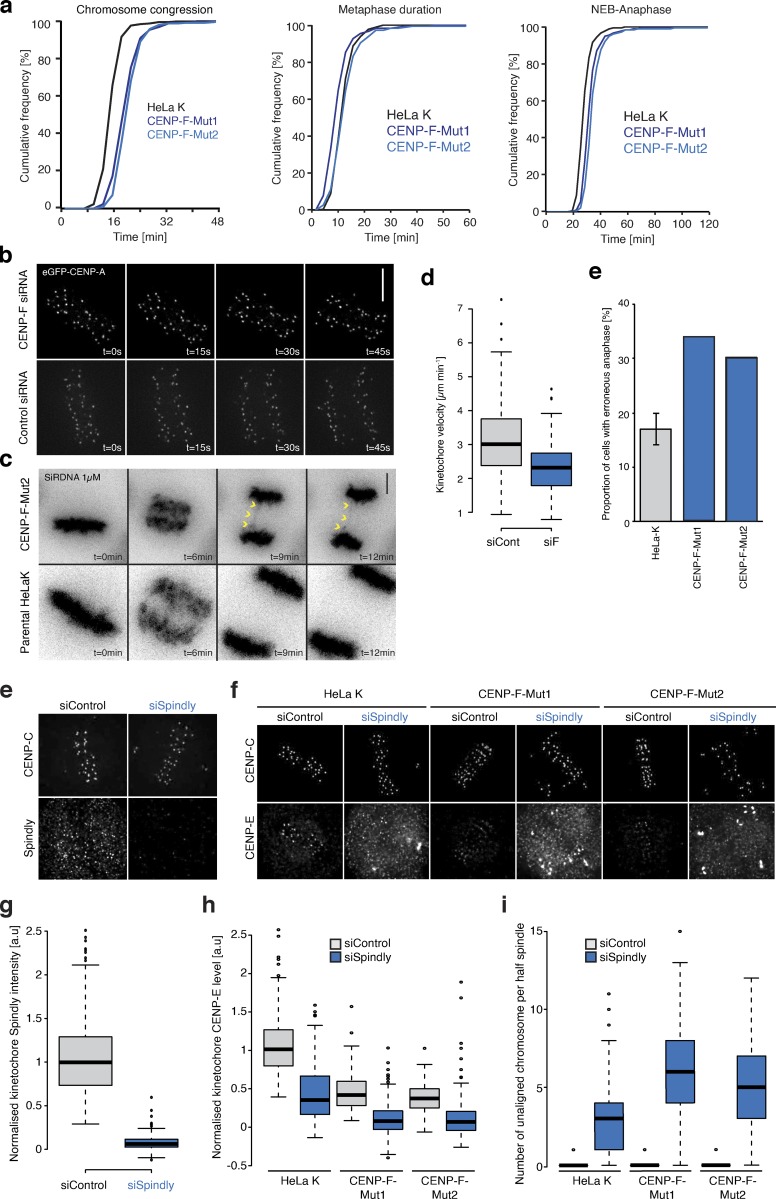
Figure S5.
Loss of CENP-F perturbs mitotic progression and influences the Spindly dependent retention of CENP-E. (a) Cumulative frequency plots of congression time, metaphase duration, and nuclear envelope breakdown-anaphase in HeLa-K, CENP-F-Mut1, and CENP-F-Mut2 cells visualized with 1 µM SiRDNA. (b) Video stills of anaphase eGFP-CENP-A–expressing cells treated with either control or CENP-F siRNA. Scale bar, 5 µm. (c) Images of HeLa-K or CENP-F-Mut2 cells labeled with 1 µM SiRDNA progressing though anaphase. Yellow arrows indicate an error. Scale bar, 5 µm. (d) Quantification of anaphase kinetochore velocity in eGFP-CENP-A–expressing HeLa cells treated with control or CENP-F siRNA. Velocity measurements were taken from tracks of processive movement that lasted at least three time frames. (e) Quantification of anaphase error rates in HeLa-K, CENP-F-Mut1, and CENP-F-Mut2 cells. (f) Immunofluorescence microscopy images of HeLa-K cells treated with control or Spindly siRNA and stained with DAPI and antibodies against CENP-C and Spindly. Scale bar, 5 µm. (g) Quantification of kinetochore Spindly level relative to CENP-C in HeLa-K cells treated with control or Spindly siRNA. (h) Immunofluorescence microscopy images of HeLa-K, CENP-F-Mut1, and CENP-F-Mut2 cells treated with control or Spindly siRNA and stained with DAPI and antibodies against CENP-C and CENP-E. Scale bar, 5 µm. (i) Quantification of kinetochore CENP-E level relative to CENP-C in HeLa-K, CENP-F-Mut1, and CENP-F-Mut2 cells treated with control or Spindly siRNA. (j) Quantification of the number of unaligned chromosomes per half-spindle in HeLa-K, CENP-F-Mut1, and CENP-F-Mut2 cells treated with control or Spindly siRNA. In d, g, h, and i, boxes depict the median and first and third quartiles, and whiskers represent Q1 and Q3 ± 1.5× interquartile range.

