Figure 1.
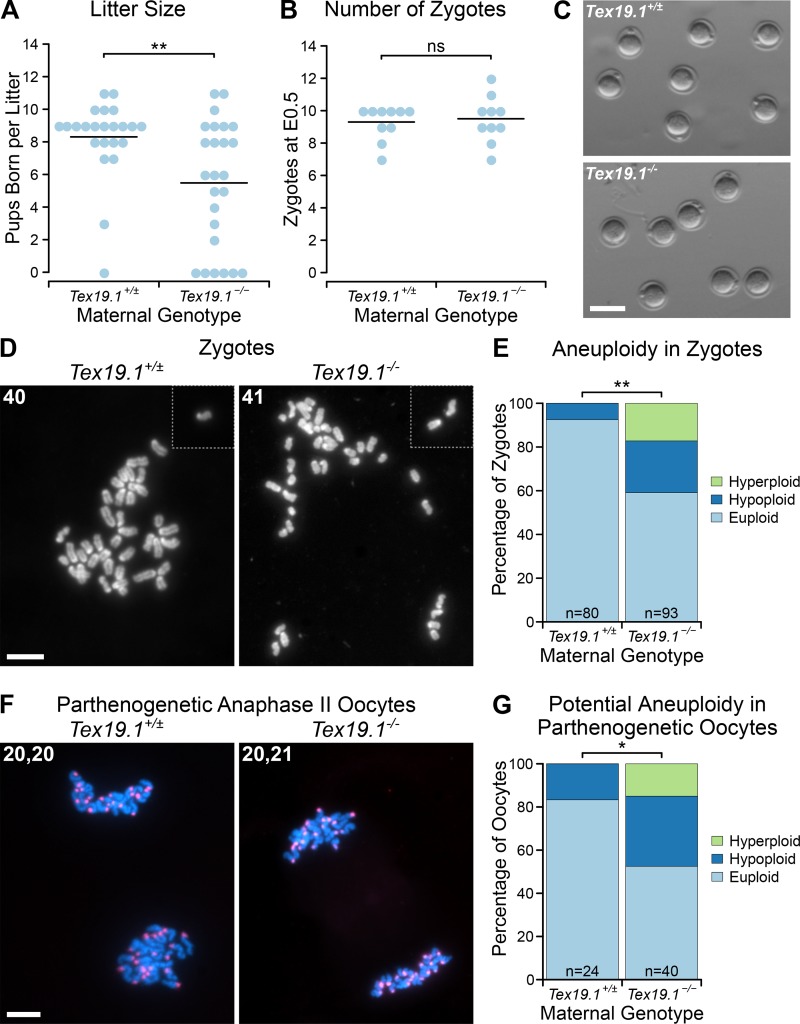
Subfertility in Tex19.1−/− females is associated with increased oocyte aneuploidy. (A and B) Number of pups born (A) and E0.5 zygotes (B) per litter after mating with wild-type males. Horizontal bars indicate means. Tex19.1+/± and Tex19.1−/− females have litter sizes of 8.3 ± 3.9 and 5.5 ± 2.4 pups born (**, Mann-Whitney U test, P < 0.01; n = 23, 25); and carry 9.3 ± 1.1 and 9.5 ± 1.4 E0.5 zygotes respectively (ns, Mann-Whitney U test, no significant difference; n = 10, 10). Data are from 7 Tex19.1+/± and 7 Tex19.1−/− females (A) and from 10 Tex19.1+/± and 10 Tex19.1−/− females (B). (C) E0.5 zygotes from Tex19.1+/± and Tex19.1−/− females. Scale bar 100 µm. (D and F) Chromosome spreads from E0.5 zygotes (D) and parthenogenetically activated anaphase II oocytes (F). The number of chromosomes is indicated in the top left of each image; dotted lines separate chromosomes from adjacent fields of view. DNA was visualized with DAPI (gray in D, cyan in F) and centromeres by major satellite FISH (red in F). Higher-magnification images of the oocytes shown in F are in Fig. S1 B. Scale bars, 20 µm. (E and G) Quantification of aneuploidy in E0.5 zygotes (E) and potential aneuploidy in parthenogenetically activated anaphase II oocytes (G). Aneuploid zygotes are more frequent in Tex19.1−/− females (24% hypoploid, 17% hyperploid, n = 80) than Tex19.1+/± females (7.5% hypoploid, 0% hyperploid, n = 93; **, Fisher’s exact test, P < 0.01; *, P < 0.05). Data are from eight Tex19.1+/± and eight Tex19.1−/− females. Euploid anaphase II oocytes with unequal numbers of chromosomes in each chromosome mass (e.g., 21, 19) were counted as 0.5 in each of the hypoploid and hyperploid categories (six Tex19.1−/− and no Tex19.1+/± oocytes). Potential aneuploidy in Tex19.1−/− parthenogenetic oocytes (32.5% hypoploid, 15% hyperploid, n = 24) is more frequent than in Tex19.1+/± parthenogenetic oocytes (17% hypoploid, 0% hyperploid, n = 40; *, Fisher’s exact test, P < 0.05). Data are from five Tex19.1+/± and seven Tex19.1−/− females.

