Figure 1.
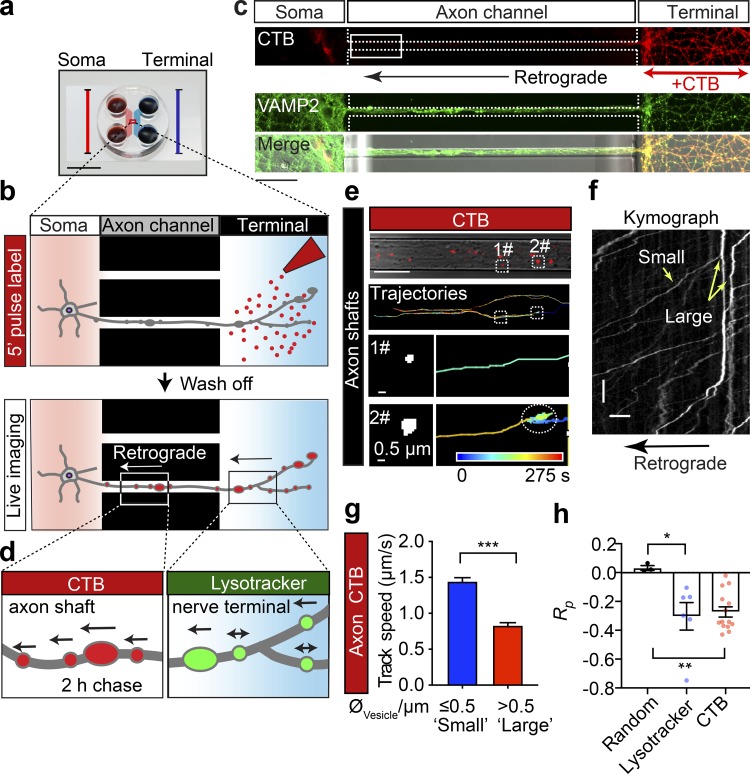
The speed of retrograde axonal transport cargoes is inversely correlated with their size. (a) Microfluidic chambers isolate unidirectional axon bundles (scale bar = 1 cm; adapted from Xonamicrofluidics.com). (b) Schematic diagram of the pulse-chase labeling process. Cultured hippocampal neurons were grown in a microfluidic device for DIV14. The nerve terminal chamber was incubated with fluorescently tagged CTB (50 ng/ml) for 5 min or Lysotracker (50 nM) for 30 min (pulse) after thorough washes and a 2-h chase. (c) Representative images of cultured neurons, showing the restriction of retrograde CTB surface labeling to nerve terminals and the position of the observation window (white box). Scale bar = 50 µm. (d) The axonal retrograde transport of CTB or Lysotracker was monitored at the level of the proximal axon shafts or in the nerve terminal chamber, respectively. (e) Time-lapse images of CTB carriers. Top: CTB labeling and tracing trajectories within the axon channels. Trajectories of small (1#, diameter ≤0.5 µm) and large (2#, diameter >0.5 µm) carriers are magnified in the bottom panels, respectively. (f) Representative kymographs of CTB-positive cargoes along a single axon, depicting track displacements of small and large carriers. x bar = 10 µm; y bar = 10 s. (g) Grouped analysis of the average speeds of CTB cargoes with small (0.5 µm) and large (>0.5 µm) diameters. Data represent mean ± SEM (small, n = 248, large n = 287 tracks from three independent preparations; ***, P < 0.001, two-tailed unpaired t test). (h) Pearson’s coefficient of the speed and diameter of retrograde Lysotracker-positive and CTB-positive cargoes. Data represent mean ± SEM from three independent preparations (random, n = 3 simulated datasets; Lysotracker, n = 6; CTB, n = 14; n represents the number of axon channels analyzed; the single value of the average correlation coefficient between the size and speed of all trajectories in each axon channel was calculated and used for the plot). Three independent groups of Gaussian-distributed random numbers were generated using the normrnd function of MATLAB. *, P < 0.05; **, P < 0.01, two-tailed unpaired t test.

