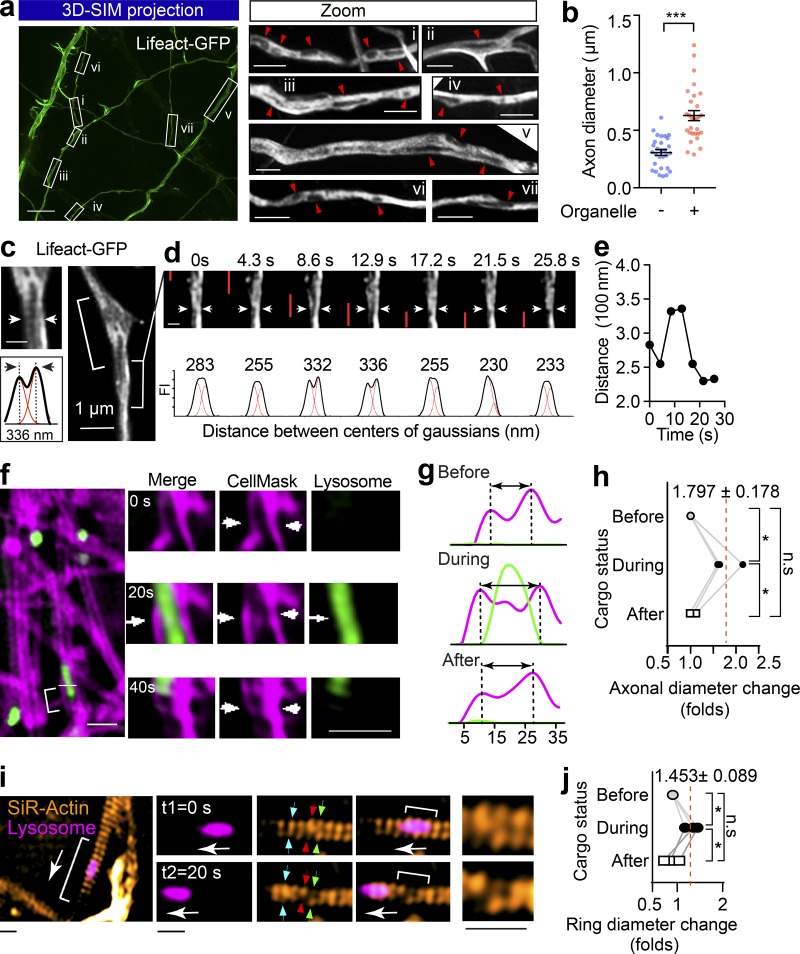
Figure 3.
The passage of large axonal cargoes causes a transient radial expansion of the axon. (a) Rat hippocampal neurons were transfected with Lifeact-GFP and imaged with 3D SIM. Left: Representative maximum projection of 3D SIM of Lifeact-GFP expressing axons are shown. Scale bar = 5 µm. Right: Magnified ROIs in left panel. Arrowheads indicate fluorescence voids with low Lifeact-GFP signals within the axon. Scale bar = 1 µm. (b) Quantification of axon diameters with (+) and without (−) unlabeled organelles. Data represent mean ± SEM from three independent preparations (+ black hole, n = 29, − black hole, n = 29 axons; ***, P < 0.001, two-tailed unpaired t test). (c) Rat hippocampal neurons cultured in a glass-bottom dish were transfected with Lifeact-GFP (DIV12) and imaged by time-lapse SIM (DIV14). Representative live axons with unlabeled cargoes passing through are shown, with inset demonstrating the Gaussian fittings of the annotated line transection of axon. Scale bar = 0.5 µm (inset). (d) Time-lapse images of bracketed region in c, showing the axonal diameter fluctuation as the cargo (indicated with red bar) transits. (e) Plot of the distance between axon membranes against time. (f) Representative time-lapse dual-color SIM of live axons with plasma membrane labeled with CellMask and Lysosome with Lysotracker red. The deformations of plasma membrane trigged by the passage of lysosome (arrows) are indicated with arrowheads. Scale bar = 2 µm. (g) Line transection of axon plasma membrane annotated with blue arrows. (h) Quantification of axonal diameter changes as cargoes pass through. Data represent mean ± SEM from three axons (*, P < 0.05, two-tailed paired t test). (i) Representative time-lapse dual-color SIM of live axons with periodic actin rings labeled with SiR-actin and Lysosome with Lysotracker red. The deformations of actin rings trigged by the passage of lysosome are indicated with arrows and zoomed in the inlets. Scale bars = 0.5 µm. (j) Quantification of actin ring diameter changes as cargoes pass through. Data represent mean ± SEM from three axons (*, P < 0.05, two-tailed paired t test). n.s., not significant.

