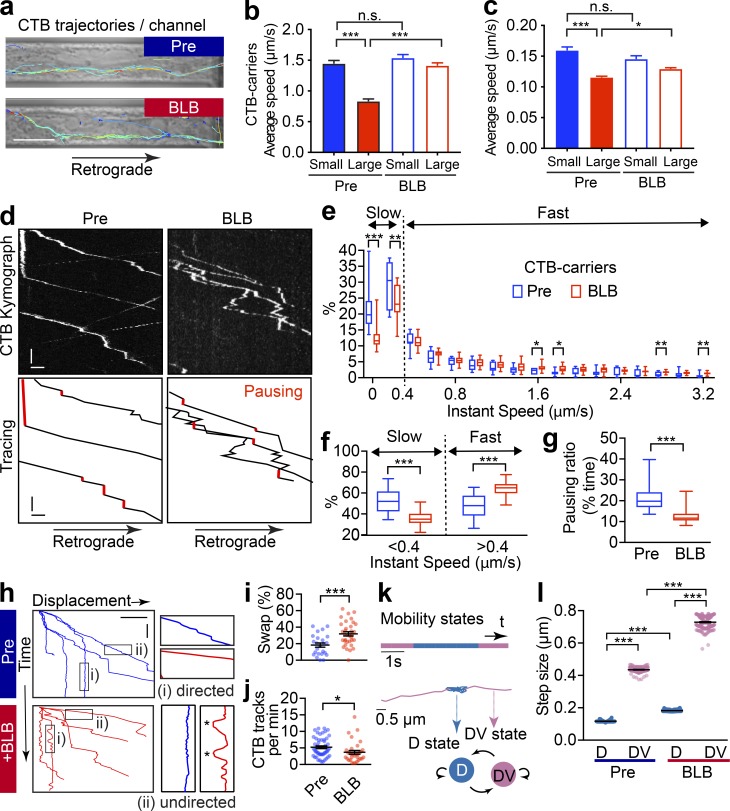
Figure 7.
Short-term inactivation of actomyosin-II reduces the efficiency of retrograde axonal trafficking. (a) DIV14 rat hippocampal neurons were cultured in microfluidic devices, and the axon segments were subjected to short-term blebbistatin treatment (10 µM, 60 min). Trajectories of CTB-positive cargoes in the axon channels were traced before (pre) and after (+BLB) blebbistatin treatment. Scale bar = 10 µm. (b and c) Track speed (trajectory length/duration) of the CTB carriers (b) or Lysotracker carriers (c) before (pre) and after (+BLB) blebbistatin treatment. The speeds of these carriers were subgrouped according to their diameters. Data represent mean ± SEM; n = 248, 287, 271, and 286 (CTB) and n = 179, 342, 128, and 573 (Lysotracker) trajectories from three independent cultures (*, P < 0.05, ***; P < 0.001, two-tailed unpaired t test). The same data of pretreated groups were used in Fig. 1 g and Fig. S1, b–d. (d) Representative kymographs of CTB carriers in single axons before (Pre) and after 60-min blebbistatin (+BLB) treatment. Tracings of retrograde CTB carriers are shown in the right panels. Pausing states with the trajectories are indicated with red. x bar = 5 s; y bar = 1 µm. (e) Frequency distribution of the instant speed of CTB carriers. Showing a significant decrease in the frequency of slow carriers (0–0.4 µm/s) and a significant increase in the fast carriers (0.4–3.2 µm/s). (f) Grouped analysis of instant speeds of slow or fast CTB carriers showing a significant difference before (Pre) and after 60-min blebbistatin (+BLB) treatment. (g) The ratio of pausing CTB carriers (instant speed, 0–0.2 µm/s). Data are shown in box and whiskers (min to max); n = 11 (Pre) and 19 (+BLB) axon channels from three independent preparations (*, P < 0.05; **, P < 0.01; ***, P < 0.001, two-tailed unpaired t test; e–g). (h) Displacement–time plot of representative Imaris-traced CTB trajectories. Directed (i) and undirected (ii) states, as magnified on the right, with the back-and-forth movements marked with asterisks. x bar = 10 µm; y bar= 20 s. (i) Time ratio of cargo traveling in the reverse direction (swap) to total time traveled. Data represent mean ± SEM; n = 28 (Pre) and 34 (+BLB) channels from three independent preparations (***, P < 0.001, two-tailed unpaired t test). (j) Quantification of the frequency of CTB-labeled vesicles that cross the observation window per minute. Data represent mean ± SEM; n = 51 (Pre) and 32 (+BLB) channels from three independent preparations (*, P < 0.05, two-tailed unpaired t test). (k) CTB trajectory displays directed (D, blue) and undirected (DV, pink) motion states inferred by HMM-Bayes analysis. Example of an annotated trajectory color-coded with the indicated motion states. The time line shows the temporal (s) sequence of the inferred D and DV motion states. (l) Step sizes of the two motion states before (pre) and after (+BLB) blebbistatin treatment. Data represent mean ± SEM; from left to right, n = 126, 126, 190, and 190 different trajectories from three independent preparations (***, P < 0.001, two-tailed unpaired t test). n.s., not significant.

