Figure 1.
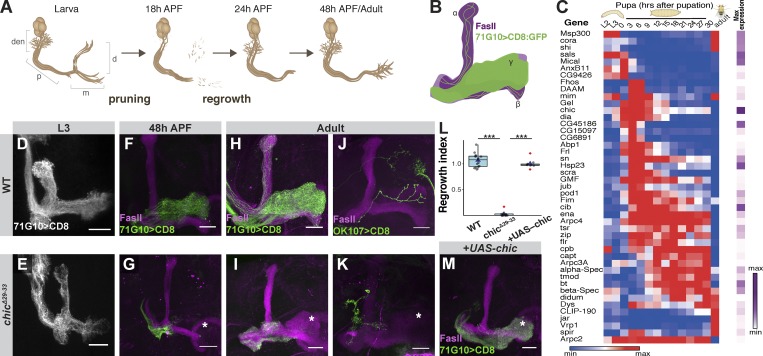
Chickadee is cell autonomously required for developmental regrowth of MB γ-neurons. (A) Schematic representation of MB remodeling. Den, dendrites; p, peduncle; d, dorsal lobe; m, medial lobe. (B) Scheme of MB demonstrating that 71G10-Gal4–driven GFP labels the γ-neurons and a subset of α/β neurons and that FasII antibody weakly labels the γ lobe and strongly labels the α/β lobes. (C) Heatmap depicting the relative RNA expression levels of genes relevant to actin dynamics throughout development from second instar larva (L2) to adult. The purple scale depicts the peak expression of each gene relative to others presented in the scheme. Genes are ordered based on their clustered expression. See Alyagor et al. (2018) for technical details. (D–K and M) Confocal z-projections of WT (D, F, H, and J) or chicΔ29-33 (E, G, I, and K) or chicΔ29-33 additionally expressing a UAS-chic transgene (M) MB γ-neuron neuroblast (D–I and M) or single cell (J and K) MARCM clones at L3 (D and E), 48 h APF (F and G), or adult (H–K and M). Asterisk marks distal tip of the adult γ lobe. While chicΔ29-33 γ-neurons initially extend axons normally (E), axons fail to regrow into the adult γ lobe following pruning (G, I, and K). Expressing UAS-chic within chicΔ29-33 clones rescues the regrowth defect (M). (L) Box plot quantification of MB γ axon regrowth, depicted as a regrowth index, of H (n = 15), I (n = 12), and M (n = 9). The quantification method is detailed in the Materials and methods section. ***, P = 2 × 10⁻¹⁶ (t test between the labeled groups). Boxes encompass the values in between the first and third quartiles; whiskers are ± 1.5 interquartile range (IQR); median (line), mean (blue triangle), and outliers (red diamond). Gray is R71G10-Gal4–driven mCD8::GFP. Green is the γ-specific driver R71G10-Gal4 (D–I and M) or the pan-MB driver OK107-Gal4 (J and K)–driven mCD8::GFP. Magenta represents FasII staining. Scale bars, 20 µm.

