Figure 1.
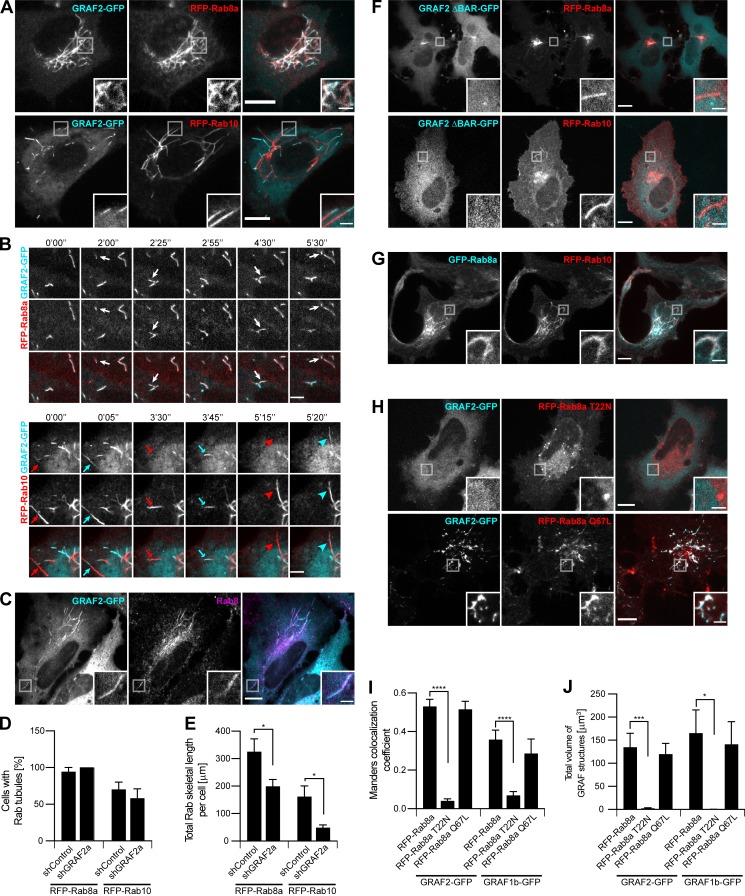
GRAF1b/2 colocalize with Rab8a/b and Rab10 in HeLa cells. (A and B) Confocal images of transfected live cells showing overlapping (RFP-Rab8a) or contiguous (RFP-Rab10) colocalization with GRAF2-GFP on intracellular tubules. (B) Snapshots were taken every 5 s. Regions with dynamic tubules are shown at relevant time points. Rab8a and GRAF2 appeared simultaneously (white arrows), but Rab10 (red arrows/arrowheads) preceded GRAF2 (cyan arrows/arrowheads). Scale bars: 5 µm. (C) Confocal images of transfected cells stained with α-Rab8 showing Rab8 on GRAF2-GFP tubules. (D and E) shControl or shGRAF2a-expressing cells were transfected with RFP-Rab8a or Rab10. (D) Proportion of cells with Rab8a/10–positive tubules. n = 3. (E) Total skeletal length of RFP-Rab8a/10 structures per cell. n = 24–40 cells. (F–H) Confocal images of transfected cells. (F) GRAF2 ΔBAR-GFP was not found on RFP-Rab8a/10 tubules. (G) GFP-Rab8a and RFP-Rab10 colocalized. (H) GRAF2-GFP was diffuse when expressed with RFP–Rab8a T22N but colocalized with RFP–Rab8a Q67L. (I and J) Cells were cotransfected with GRAF1b/2–GFP and RFP-Rab8a, Rab8a T22N, or Rab8a Q67L. (I) Manders colocalization coefficients for GRAF1b/2 on Rab8a-positive structures. (J) Total volume of GRAF1b/2-GFP–positive structures per cell. (I and J) n = 15–45 cells. (D, E, I, and J) Data are means ± SEM; *, P < 0.05; ***, P < 0.001; and ****, P < 0.0001. (A, C, and F–H) Insets show magnifications of the boxed areas. Scale bars: 10 µm; scale bars of insets: 2 µm.

