Figure 4.
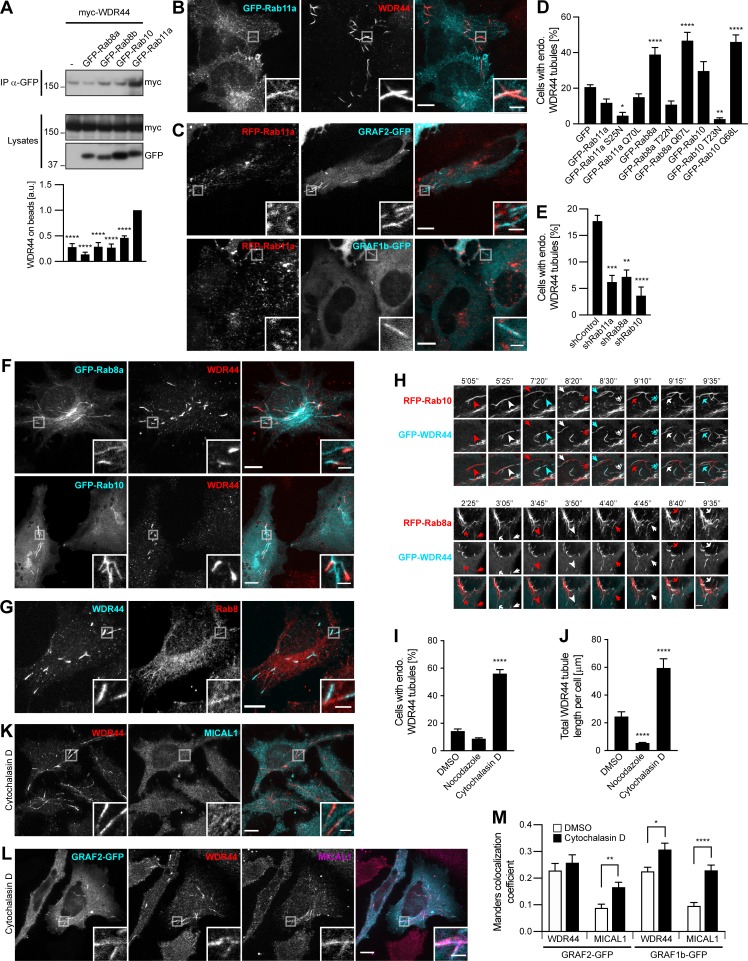
WDR44 tubules form in a Rab11-, Rab8-, and Rab10-dependent manner and are induced by Cytochalasin D. (A) Immunoprecipitation (IP) of transfected 293T cells with α-GFP. The efficiency of myc-WDR44 binding was quantified using coimmunoprecipitation with GFP-Rab11a as reference. n = 3–5. myc-WDR44 only bound to Rab11a. (B and C) Confocal images of transfected HeLa cells. (B) Cells were stained with α-WDR44. GFP-Rab11a was found on endogenous WDR44 tubules, but WDR44 was absent from GFP-Rab11a–positive endosomes. (C) RFP-Rab11a was absent from GRAF1b/2–positive tubules. (D and E) Percentage of HeLa cells with endogenous (endo.) WDR44 tubules. (D) n = 3–6. (E) n = 3. (F) Confocal images of transfected HeLa cells stained with α-WDR44 showing endogenous WDR44 on the end of GFP-Rab8a and GFP-Rab10 tubules. (G) Confocal images of untransfected HeLa cells stained with α-WDR44 and α-Rab8 showing colocalization on tubules. (H) Confocal images of transfected HeLa cells. Snapshots were taken every 5 s. Regions with dynamic tubules are shown at relevant time points. Top: Stills from Video 7. Arrows/arrowheads point at tubules that were first positive for Rab10 (red), then acquired WDR44 (white), and finally lost Rab10, leaving only WDR44 (cyan). Bottom: Stills from Video 8. Arrows/arrowheads point at newly formed Rab8a tubules (red) that then acquired WDR44 (white). Rab8a did not clearly dissociate from WDR44 tubules. Scale bars: 5 µm. (I and J) HeLa cells were incubated with DMSO (vehicle, 2 h), Nocodazole (20 µg/ml, 2 h), or Cytochalasin D (0.5 µg/ml, 30 min) and stained with α-WDR44. (I) Percentage of cells with endogenous (endo.) WDR44 tubules. n = 4–6. (J) Total length of WDR44 tubules per cell. n = 70–100 cells. (K and L) Confocal images of untransfected (K) or transfected (L) HeLa cells incubated with Cytochalasin D (0.5 µg/ml, 30 min) and stained with α-WDR44 and α-MICAL1. (M) Manders colocalization coefficients for endogenous WDR44 and MICAL1 on GRAF1b/2–GFP structures in DMSO or Cytochalasin D–treated cells. n = 20–33 cells. (A, D, E, I, J, and M) Data are means ± SEM; *, P < 0.05; **, P < 0.01; ***, P < 0.001; and ****, P < 0.0001. (B, C, F, G, K, and L) Insets show magnifications of the boxed areas. Scale bars: 10 µm; scale bars of insets: 2 µm.

