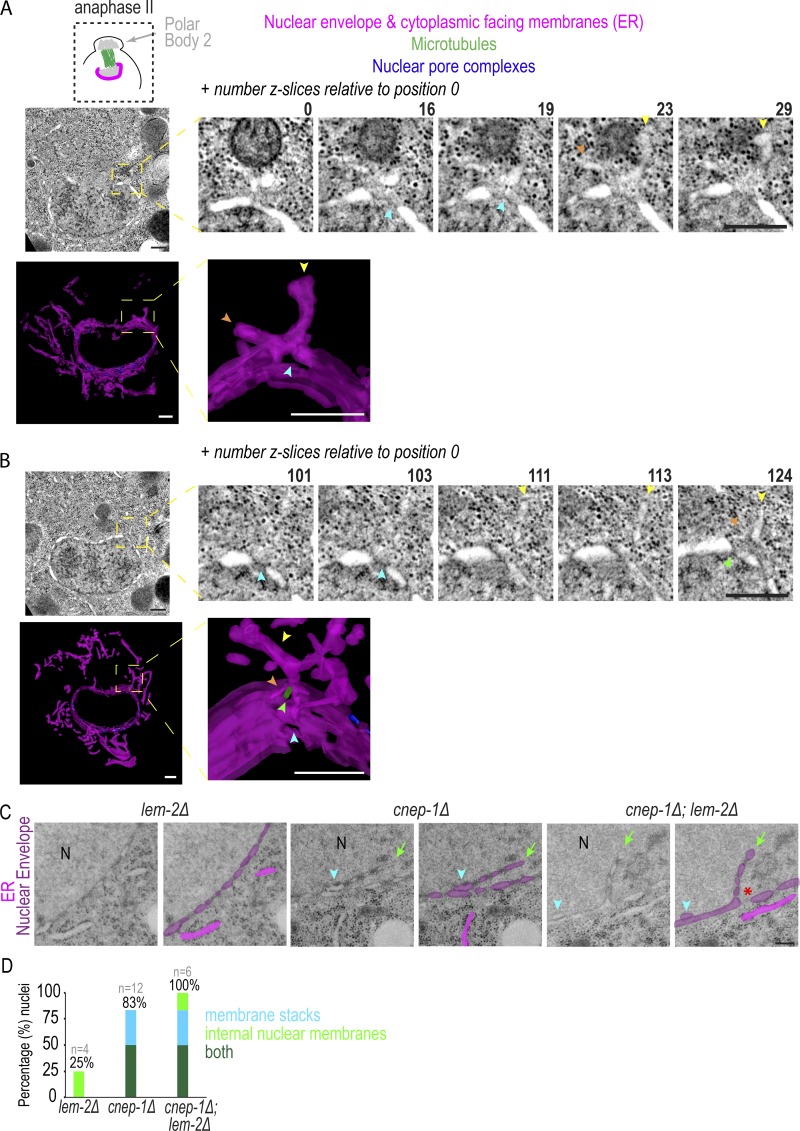
Figure 2.
Cytoplasmic membrane structures are directly adjacent to NE holes occupied by meiotic spindle MTs. (A and B) Top: Z-slices from electron tomograms of an oocyte-derived pronucleus in anaphase of meiosis II. z-slices are relative to position 0. Bottom: 3D models with membranes (magenta) traced. Arrowheads mark membrane sheets (yellow and orange), NE holes (blue), and MTs (green). (C) Representative traced and untraced transmission electron micrographs for indicated conditions is shown. N notes the nuclear interior, arrowhead marks two parallel lumens, and arrow marks NE extension. (D) Plot of frequency of indicated NE phenotypes in transmission electron micrographs, n = no. of nuclei. Scale bars, 250 nm.

