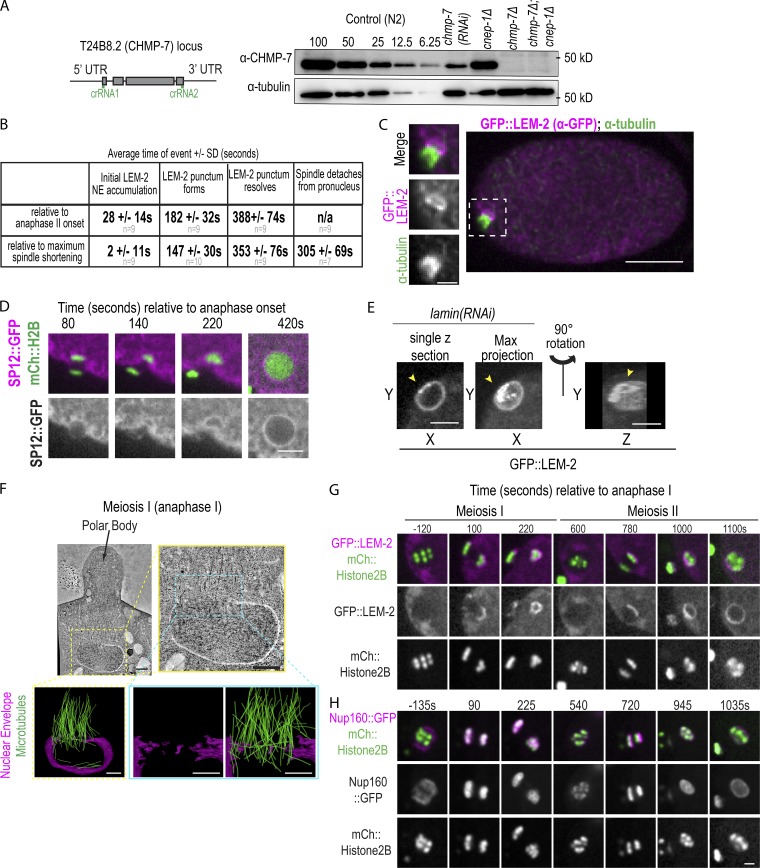
Figure S1.
Nuclear membranes asymmetrically enclose oocyte chromatin during nuclear formation after meiosis, related to Fig. 1 and Fig. 2. (A) Left: CRISPR strategy used to generate deletion in T24B8.2 (chmp-7) locus, a gene predicted to encode the orthologue of human CHMP7. crRNAs used are shown in green. Right: Immunoblot probed for CHMP-7 and α-tubulin. A dilution series of control (N2) worm lysate from 100% to 6.25% and 100% of lystate and chmp-7 (RNAi) and deletions for the indicated genetic backgrounds. (B) Table of time in seconds (average ± SD) of indicated events relative to chromosome segregation (anaphase II onset) or maximal spindle shortening. n = no. of embryos. (C) Fixed C. elegans embryo stained for GFP::LEM-2 (magenta) and α-tubulin (green). Magnified images on the left are of the oocyte-derived pronucleus. (D) Confocal images from a time lapse series of a C. elegans oocyte in meiosis II expressing SP12::GFP and mCherry::Histone2B. Representative example of n = 5 embryos is shown. Time is in seconds relative to anaphase II onset. Scale bar, 5 μm. (E) Single z-slice, max z-projection, and a 3D-projection of rupture site in a sperm-derived pronucleus depleted of lamin expressing GFP::LEM-2. Arrowheads mark a gap between the GFP::LEM-2 plaque that has formed at a NE rupture site. (F) Tomographic slice of C. elegans oocyte in mid-anaphase I and a magnified image of oocyte-derived pronucleus from the z-slice on the right. Below are 3D models of this region of the electron tomogram traced for nuclear membranes (magenta) and MTs (green). Scale bars, 500 nm. (G and H) Confocal images from time lapse series of the oocyte-derived pronuclei in meiosis I and II either expressing GFP::LEM-2 and mCherry::Histone2B (G) or expressing Nup160::GFP and mCherry::Histone2B (H). Time is in seconds relative to anaphase I onset. Scale bar, 2.5 µm.

