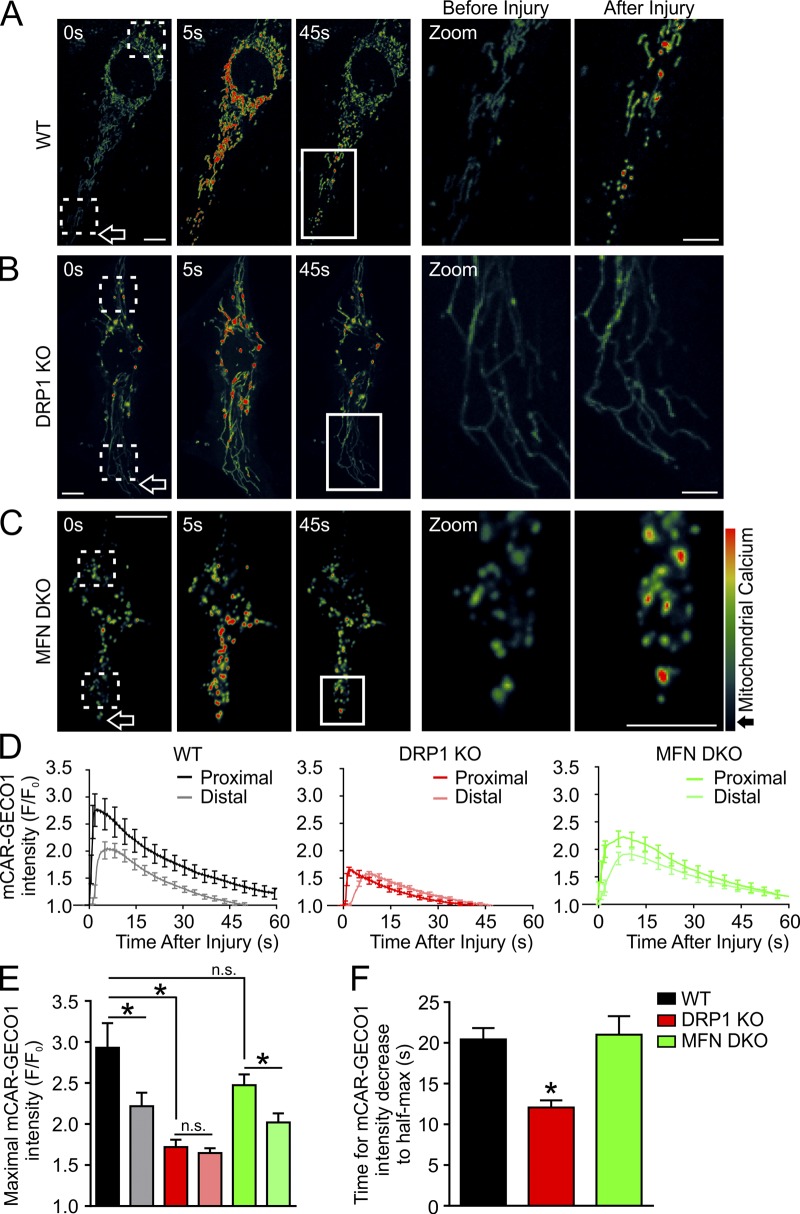
Figure 4.
Fragmented mitochondria sustain high mitochondrial calcium levels at the injury site. (A–C) Time series of mitochondrial calcium uptake (mCAR-GECO1) in WT (A), DRP1 KO (B), and MFN DKO (C) MEFs after PM injury. Dotted boxes illustrate representative injury proximal and injury distal regions used for measurements. Solid box indicates magnified area at right. Arrow marks the site of injury. Scale bar = 10 µm (whole cell) and 5 µm (zoom). (D) mCAR-GECO1 intensity after PM injury (n = 12 WT, 16 DRP1 KO, and 16 MFN DKO cells). (E) Maximal [Ca2+]m uptake in injury-proximal and injury-distal mitochondria (n = 12 WT, 16 DRP1 KO, and 16 MFN DKO cells). (F) Time for [Ca2+]m to decrease to half peak (n = 12 WT, 16 DRP1 KO, and 16 MFN DKO cells). *, P < 0.05 by unpaired t test; n.s., not significant. Error bars represent SEM.

