Figure 1.
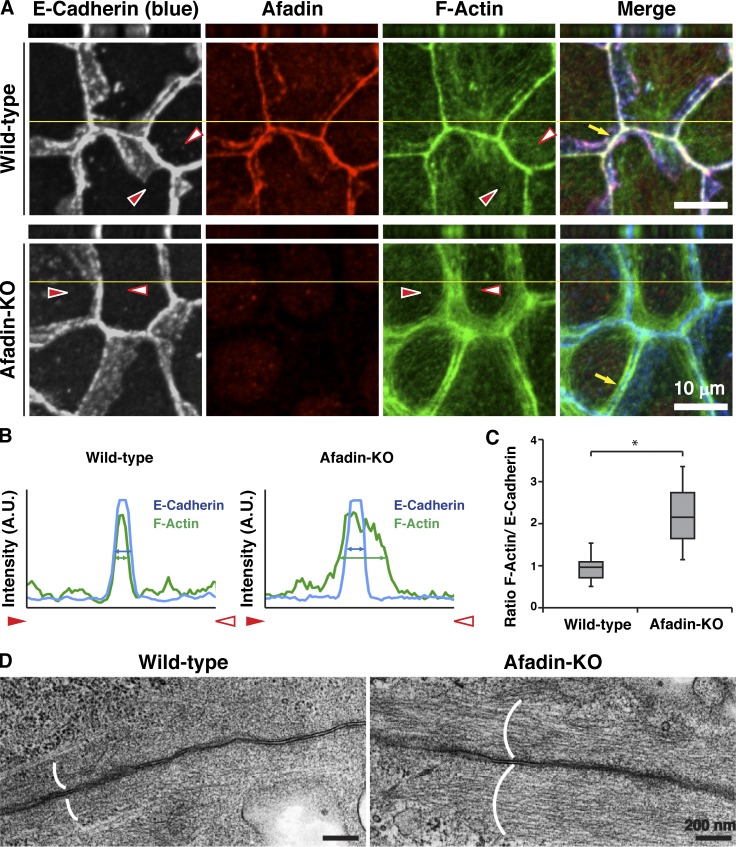
Requirement of afadin for the proper actin organization at AJs. (A–C) Localization of E-cadherin and F-actin in wild-type and afadin-KO cells. (A) Wild-type and afadin-KO cells were fixed. The samples were stained with the indicated Abs and phalloidin, followed by immunofluorescence microscopic analysis. Projected xy views (lower panels) as well as z-sectional xz views (upper panels) are presented. Planes of orthogonal sections are indicated by yellow lines. Arrows indicate the F-actin signal at bicellular AJs. Arrowheads indicate both ends of the areas where the line-scans were performed in B. (B) Quantification by line-scans of the immunofluorescence images of wild-type and afadin-KO cells in A. Line-scans were performed between the indicated arrowheads in the immunofluorescence images of A. The pixel intensities for E-cadherin (blue) and F-actin (green) are shown. The blue and green double-ended arrows indicate the full width at half maximum (FWHM) of E-cadherin and F-actin pixel intensities, respectively. (C) Statistical analysis of B. The ratios of FWHM of F-actin to FWHM of E-cadherin are indicated. Data are expressed as a box-and-whisker plot of three independent experiments (n = 10). The whiskers indicate the maximum and minimum values, and the box corresponds to the 75th percentile, median, and 25th percentile values. *, P < 0.01 (two-tailed, unpaired Student’s t test). (D) Ultrastructural images of F-actin bundles at AJs. Wild-type and afadin-KO cells were fixed. The samples were subjected to transmission electron microscopic analysis. Parentheses indicate the F-actin bundles at AJs. A.U., arbitrary units.

