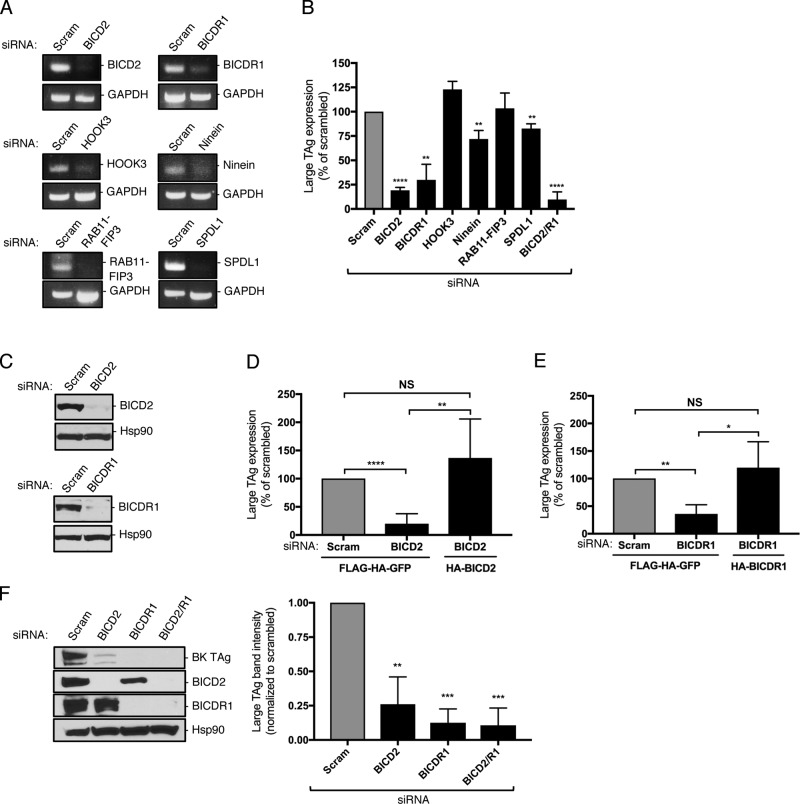
Figure 1.
The dynein cargo BICD adaptors support SV40 infection. (A) CV-1 cells were transfected with 5 nM of the indicated siRNA for 48 h. RNA was isolated and RT-PCR used to assess transcript levels. GAPDH was used as a loading control. (B) CV-1 cells were transfected with 5 nM of the indicated siRNA and infected with SV40 (MOI ∼1). At 24 hours post infection (hpi), cells were fixed and stained for large T antigen (TAg). Data were normalized to the scrambled control. (C) CV-1 cells were transfected with either a scrambled control siRNA or siRNA against BICD2 or BICDR1, and BICD2 and BICDR1 protein levels were assessed by immunoblotting. Hsp90 was used as a loading control. (D) CV-1 cells were transfected with the scrambled control siRNA or siRNA against BICD2 for 24 h. Cells were then either transfected with the FLAG-HA-GFP control construct or mouse HA-BICD2 for an additional 24 h before infection with SV40 (MOI ∼1). At 24 hpi, cells were fixed and stained for TAg. Data were normalized to the scrambled control with FLAG-HA-GFP. (E) CV-1 cells were transfected with the scrambled control siRNA or siRNA against BICDR1 for 24 h. Cells were then either transfected with the FLAG-HA-GFP control construct or mouse HA-BICDR1 for an additional 24 h before infection with SV40 (MOI ∼1). At 24 hpi, cells were fixed and stained for TAg. Data were normalized to the scrambled control with FLAG-HA-GFP. (F) CV-1 cells were transfected with 5 nM of the indicated siRNA and infected with BK PyV (MOI ∼0.5). At 48 hpi, BK TAg levels were assessed by immunoblotting. Values are averages of the means (n = 3) ± SD. A standard Student’s t test was used to determine statistical significance. *, P ≤ 0.05; **, P ≤ 0.005; ***, P ≤ 0.0005; ****, P ≤ 0.0001. See also Fig. S1.

