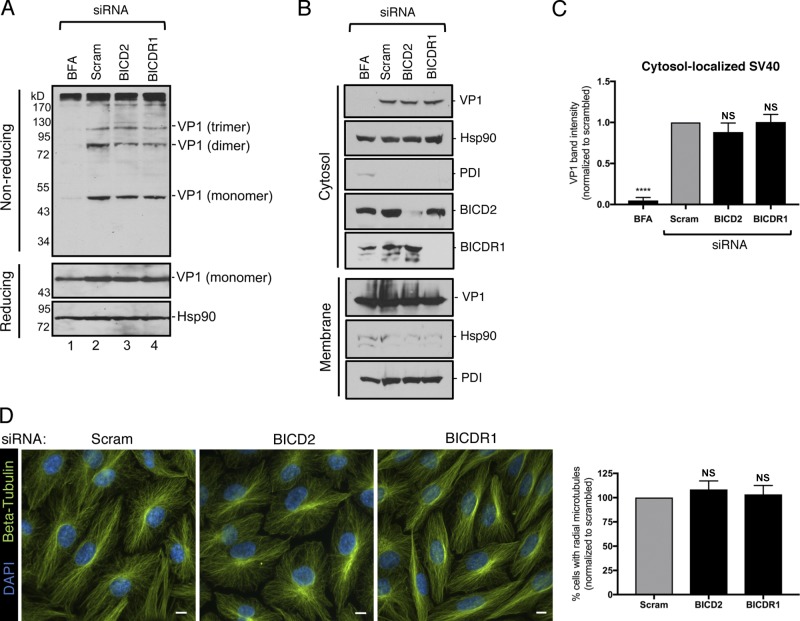
Figure 2.
BICD2 and BICDR1 do not promote SV40 ER arrival from the cell surface or cytosol arrival from the ER. (A) CV-1 cells were transfected with 5 nM of the indicated siRNA, or treated with BFA, and infected with SV40 (MOI ∼2). At 13 hpi, cells were lysed in the presence of 10 mM NEM and VP1 levels assessed by either nonreducing or reducing SDS-PAGE followed by immunoblotting. Hsp90 was used as a loading control. (B) CV-1 cells were transfected with 5 nM of the indicated siRNA or treated with BFA and infected with SV40 (MOI ∼5). At 16 hpi, cells were subjected to the ER-to-cytosol membrane transport assay (see Materials and methods). VP1 levels were assessed by immunoblotting. Cytosolic Hsp90 and ER-resident PDI were used as markers for the cytosol and membrane fractions, respectively. (C) Relative VP1 band intensities from the cytosol fraction of B were determined using FIJI. Data were normalized to the scrambled control. (D) CV-1 cells were transfected with 5 nM of the indicated siRNA and stained for β-tubulin (green). Cells were counterstained with DAPI (blue). Scale bars, 10 µm. Graph represents the number of cells with radial MT structure normalized to the scrambled control. Values are averages of the means (n = 3) ± SD. A standard Student’s t test was used to determine statistical significance. ****, P ≤ 0.0001.

