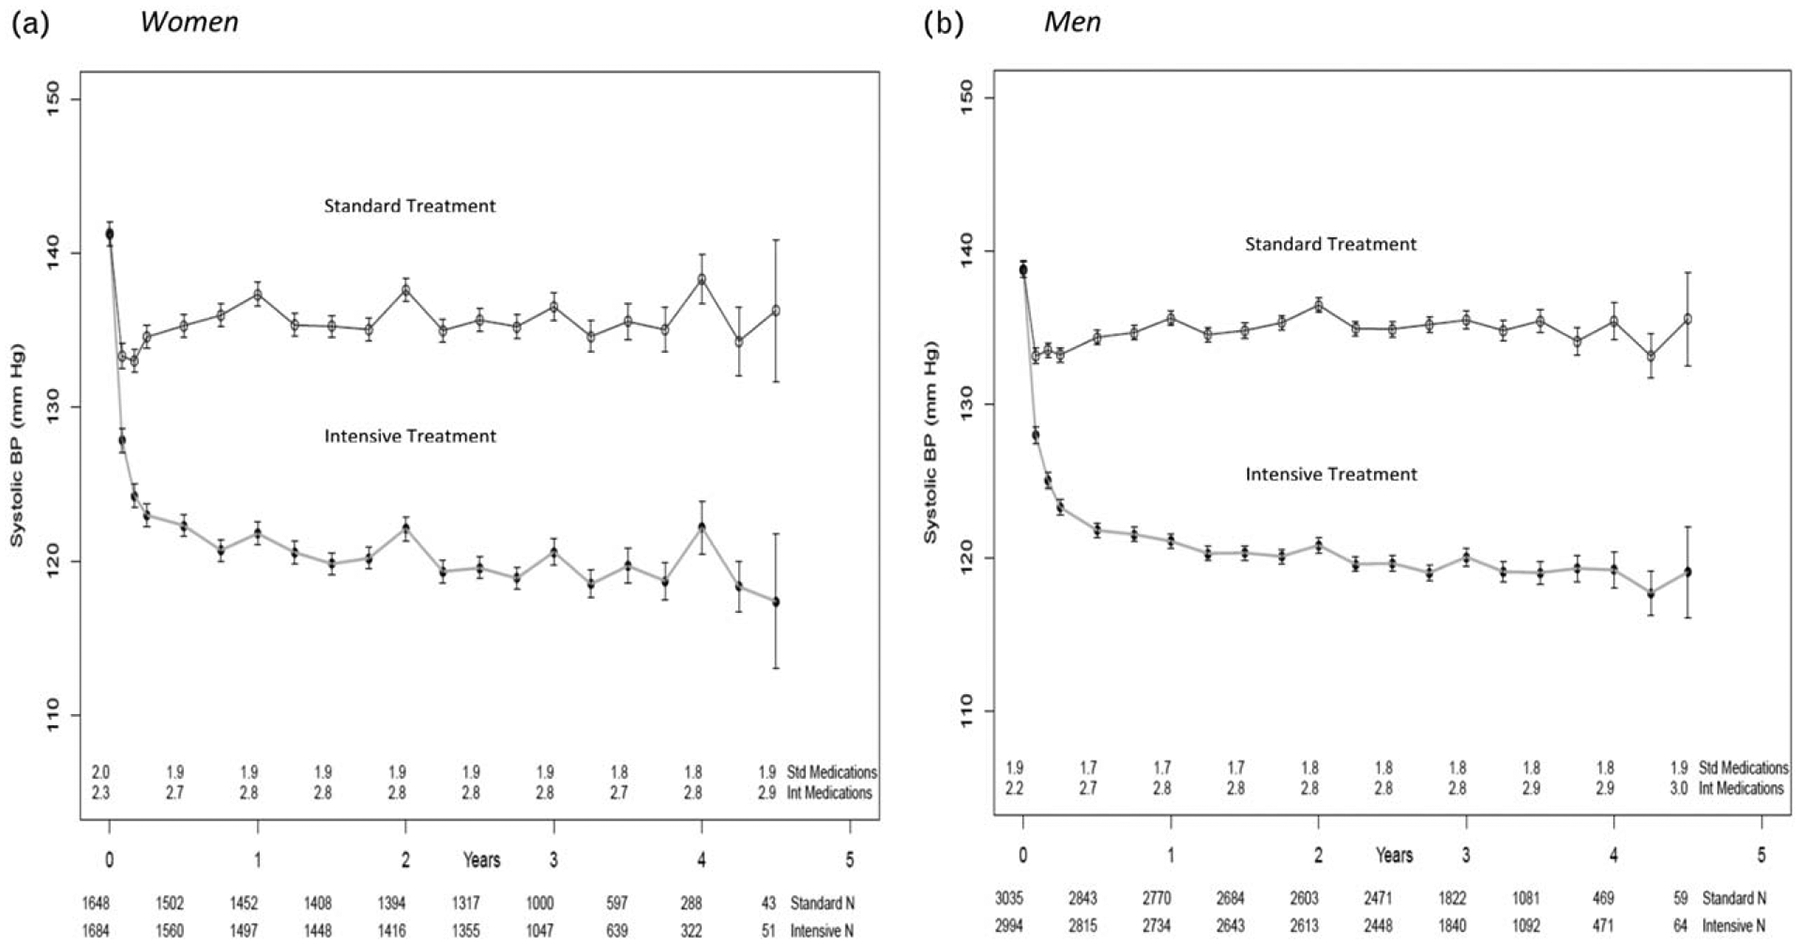
FIGURE 1.

Mean systolic blood pressure in (a) women and (b) men in the two treatment arms over the course of the trial. In both (a) and (b) the mean number of medications is the number of blood pressure medications administered at the exit of each visit and the bars represent 95% confidence intervals.
