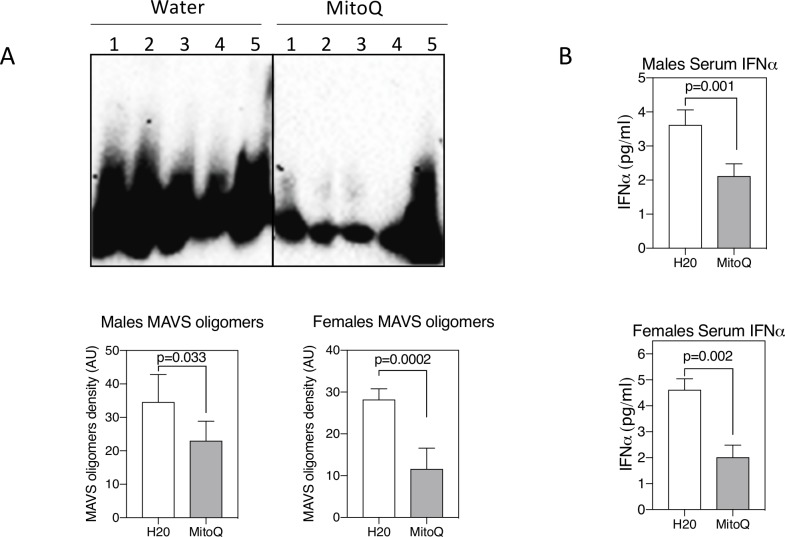
Figure 5.
Reduced mitochondrial antiviral stimulator (MAVS) oligomerisation and serum interferon (IFN)-β with MitoQ. (A) MAVS oligomers were assessed by western blot from non-denaturing agarose gels as described in the Materials and methods section. Shown are results from five mice per treatment group. Graphs indicate density of MAVS oligomers. (B) Serum IFNα as measured by ELISA. Shown are mean±SEM and statistical analysis by unpaired t-test. Results are representative of two experiments.

