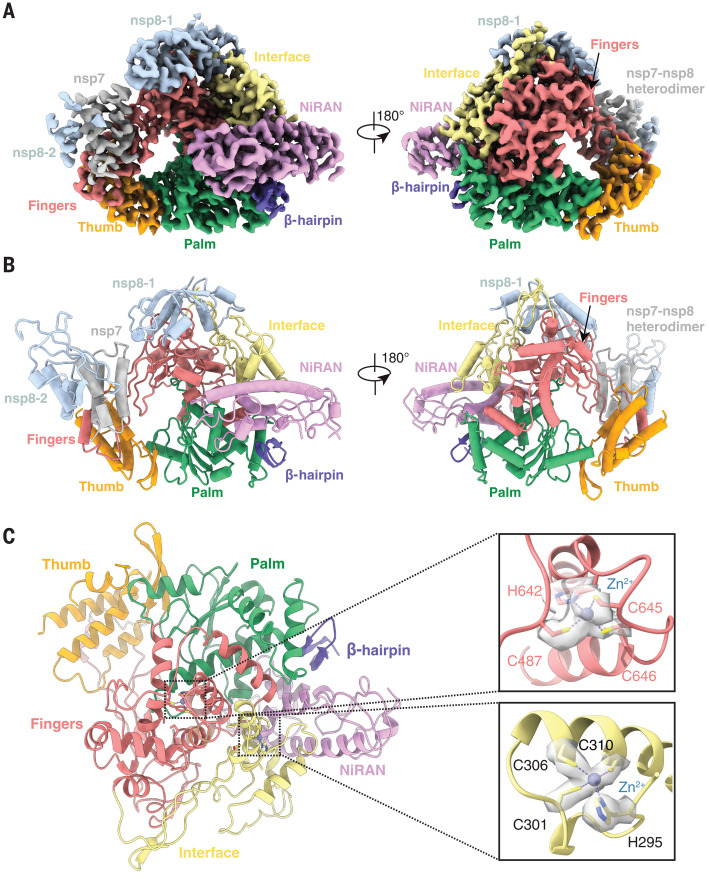
Fig. 2. Cryo-EM structure of the apo nsp12-nsp-7-nsp8 RdRp complex.
(A and B) Two views of the cryo-EM map (A) and structure (B) of the apo nsp12-nsp7-nsp8 complex. The color scheme is according to Fig. 1A and is used throughout the figures. (C) The conserved zinc binding motifs are highlighted in the apo structure rendered in ribbon. The coordinate details of the zinc-binding residues are shown in stick representation, with the EM map in gray surface representation.

