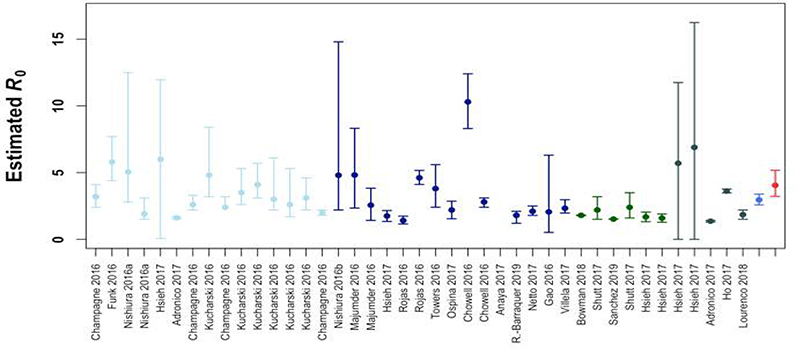
Extended Data Fig. 6. Comparison of R0 estimates from experimental data to published estimates from field studies.
Circles correspond to point estimates of R0 derived from an individual study and setting and/or methodology, while the lines show the corresponding 95% CI (n=41 estimates from 22 studies). Colors are used to show estimates from different regions (light blue: Oceania, dark blue: South America, dark green: Central America, gray: other) and our own experimental results (blue: single-feed model, red: double-feed model).

