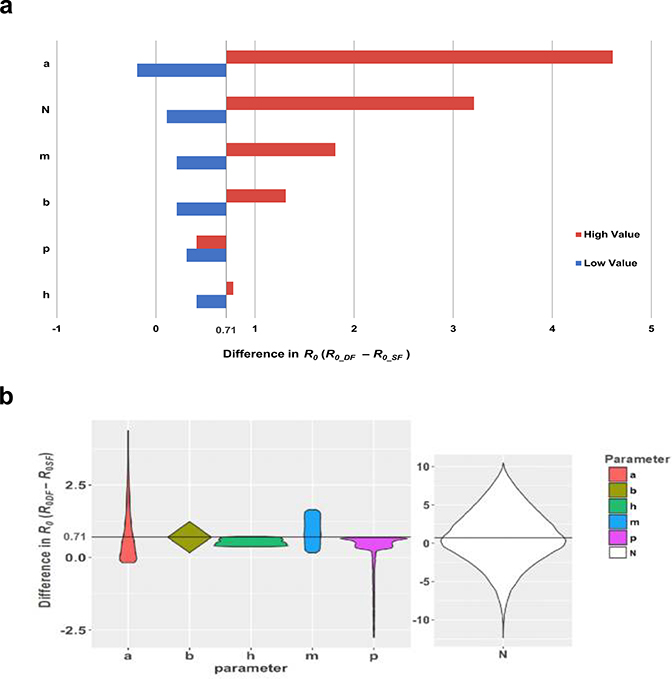
Extended Data Fig. 7. Results of a best/worst case scenario sensitivity analysis and a one-way random sampling sensitivity analysis.
(a) Scenario sensitivity analysis assessing the effect of varying each parameter according to its lowest and highest bounds on the difference in R0 ( (blue=lowest value; red=highest value for each parameter). The initial difference of 0.71 was obtained by holding all parameters constant at their mean or given value (Table S4). (b) Violin plots show the probably density of the difference in R0 when we randomly sampled each parameter 10,000 times from its specified distribution (Table S4), while holding all other parameters constant. Each violin spans the 98% quantile of the distribution of R0 differences with the width proportional to the probability of observing a particular value of difference. The horizontal line at 0.71 represents the difference in R0 when all parameters are held constant at their mean or given value.

