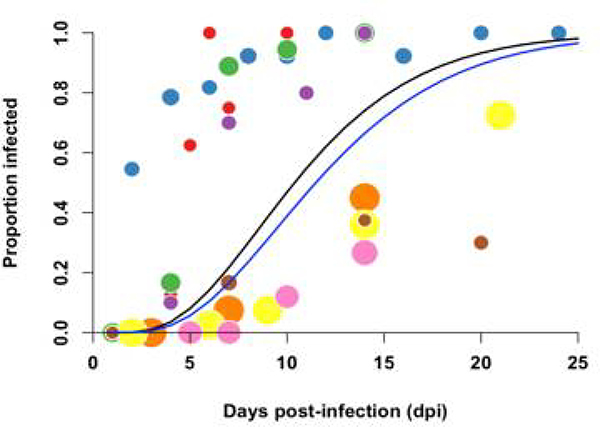
Extended Data Fig. 9. Salivary Gland Infection Meta-Analysis.
Salivary Gland Infection (SGI) data aggregated from 8 published studies are plotted, with each observation (n=45) weighted by sample size and color-coded by study. The black line shows the best-fit gamma CDF model for salivary gland data and the blue line for combined meta-analysis single-feed dissemination data (data points not shown).

