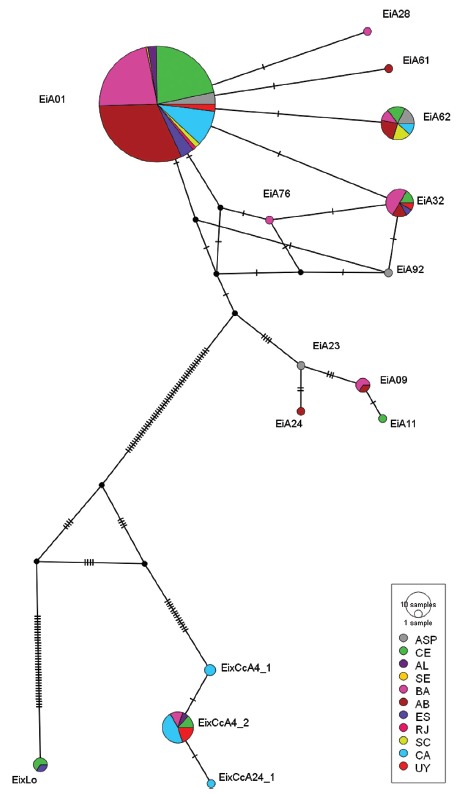
Figure 2. mtDNA (D-Loop) haplotype network constructed based on the Median-Joining method. Circles represent each of the identified haplotypes, size corresponds to the frequency of occurrence of the haplotype, and color represents the sampling location. Dashes between haplotypes represent the number of distinct bases between them.

