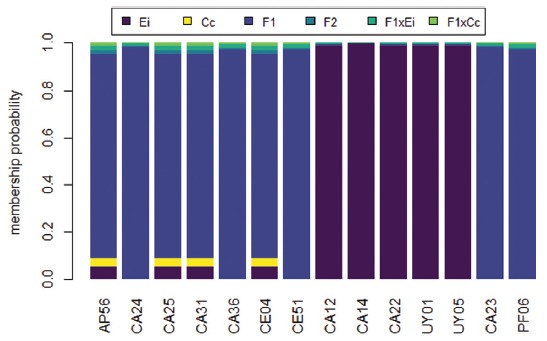
Figure 5. Assignment probability model for the 12 E. imbricata x C. caretta hybrids identified by mtDNA analysis (AP56 UY05) and two additional hybrids identified only through nDNA (CA23 and PF06). The y-axis represents the probability that each individual belongs to each of the six categories presented (Ei, Cc, F1, F2, F1xEi e F1xCc).

