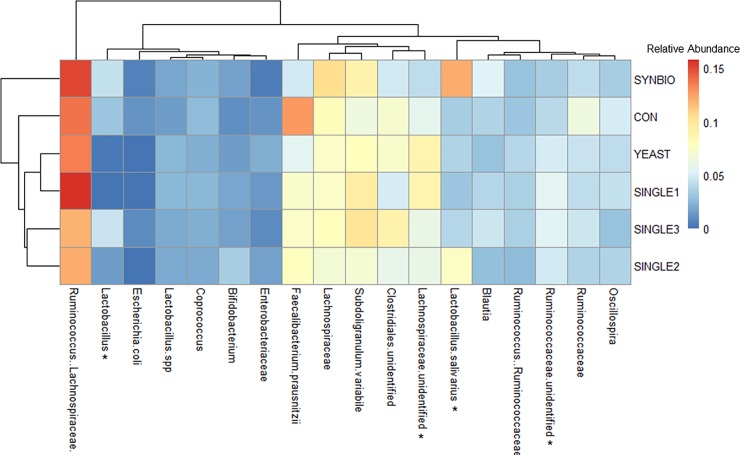
Fig 5. Double hierarchical dendrogram and heat map of cecal bacterial communities from 21-day-old broilers.
Heatmap plot represents the relative abundance changes of the most predominant microbial families, genera, and species in the ceca. Hierarchical clustering in the rows is based on the composition similarity between treatments, while that in the columns is based on the microbial relative abundances closeness. Statistical differences (P<0.05) between groups were reported for each bacterial population (*).

