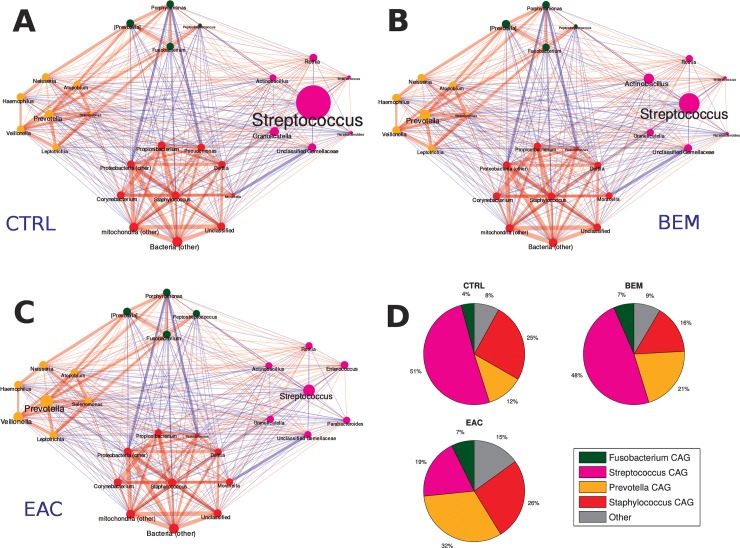
Fig 3.
Taxonomic correlations among co-abundant groups (CAGs) in (A) healthy (CTRLS), (B) BEM and (C) EAC individuals. Red edges indicate a positive correlation, while blue edges a negative one. Edge size is proportional to the correlation coefficient. Node and label size represent taxonomy abundance, while the colour indicates the belonging cluster: Streptococcus CAG in magenta, Fusobacterium CAG in green, Staphylococcus CAG in red, and Prevotella CAG in yellow. (D) Pie-charts showing the average cumulative relative abundance per CAG and experimental group. CAGs: co-abundant groups; BEM: esophageal metaplastic samples; EAC: esophageal adenocarcinoma samples; CTRL: healthy control samples.

