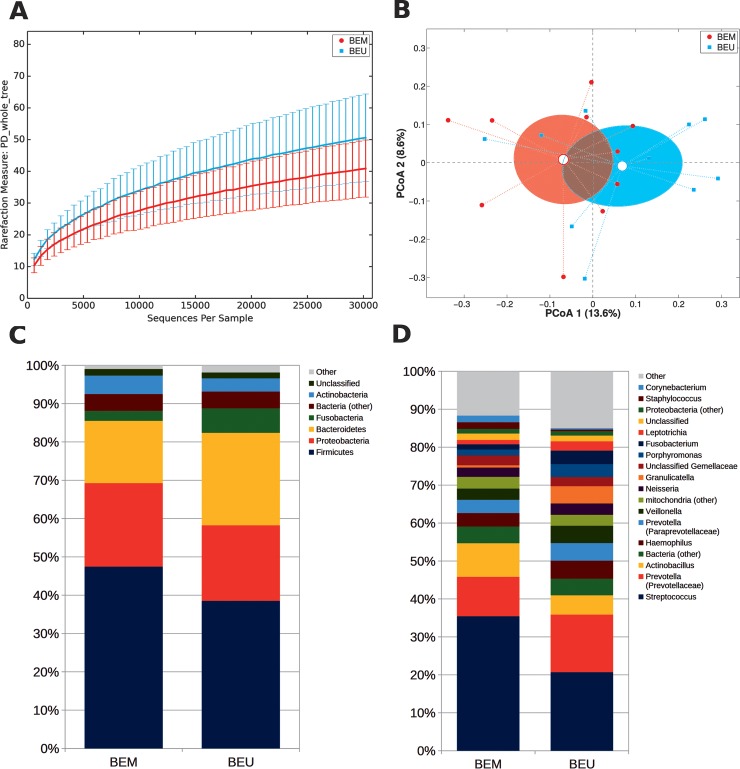
Fig 4.
(A) Alpha-diversity rarefaction curve for Faith’s phylogenetic diversity (PD_whole_tree) metric for BEM and BEU samples from BE patients. Curves represent the average value of all the samples within the experimental category; error bars represent standard deviations. (B) PCoA plot of the Bray-Curtis distances among samples; each point represents a sample, centroids are calculated as the mean coordinate of all samples per experimental category (BEM or BEU); ellipses represent the SEM-based estimation of the variance. The first and second components of the variance are shown. (C,D) Barplots of the relative abundance of the main bacterial taxa at phylum or genus level for BEM or BEU samples. Data represent the average of the relative abundance of all samples per experimental category. Only the 7 most abundant phyla and the 20 most abundant genera are plotted. BEM: esophageal metaplastic samples; BEU: normal esophageal samples obtained from patients with Barrett’s esophagus.

