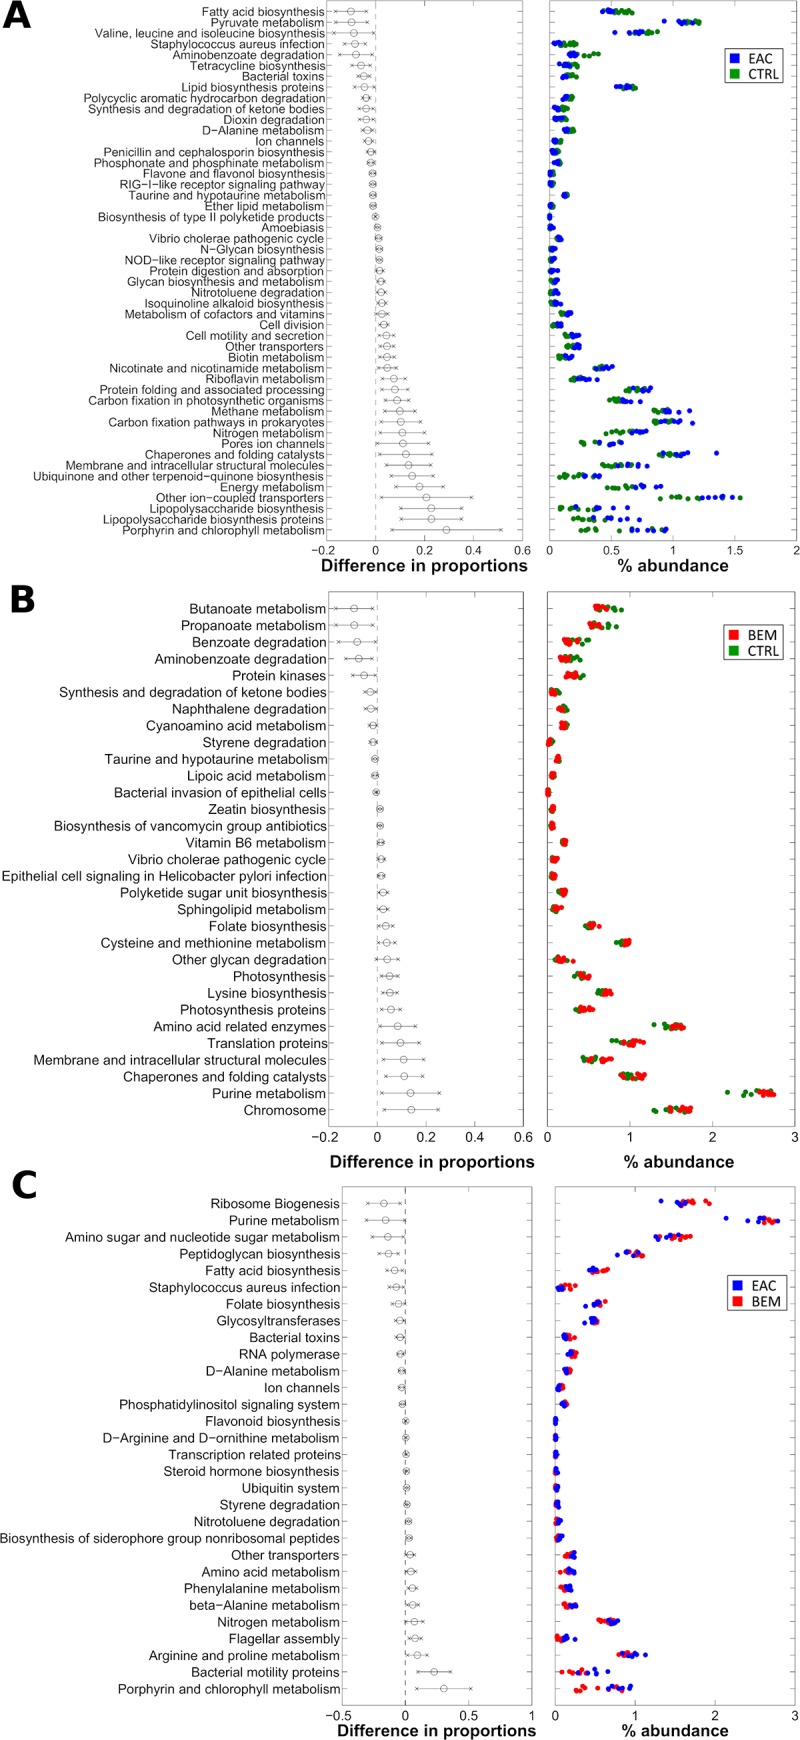
Fig 5.

Level-3 KEGG pathways significantly different between (A) EAC and CTRL, (B) BEM and CTRL (C) EAC and BEM samples from PiCRUST functional prediction. Pathways are represented on the basis of increasing difference between average proportions in the experimental categories (Black circles, leftmost panel); for each pathway, the 95% confidence interval is also represented. Rightmost panel shows the % abundance of each sample; colors indicate the experimental categories. BEM: esophageal metaplastic samples; EAC: esophageal adenocarcinoma samples; CTRL: healthy control samples.
