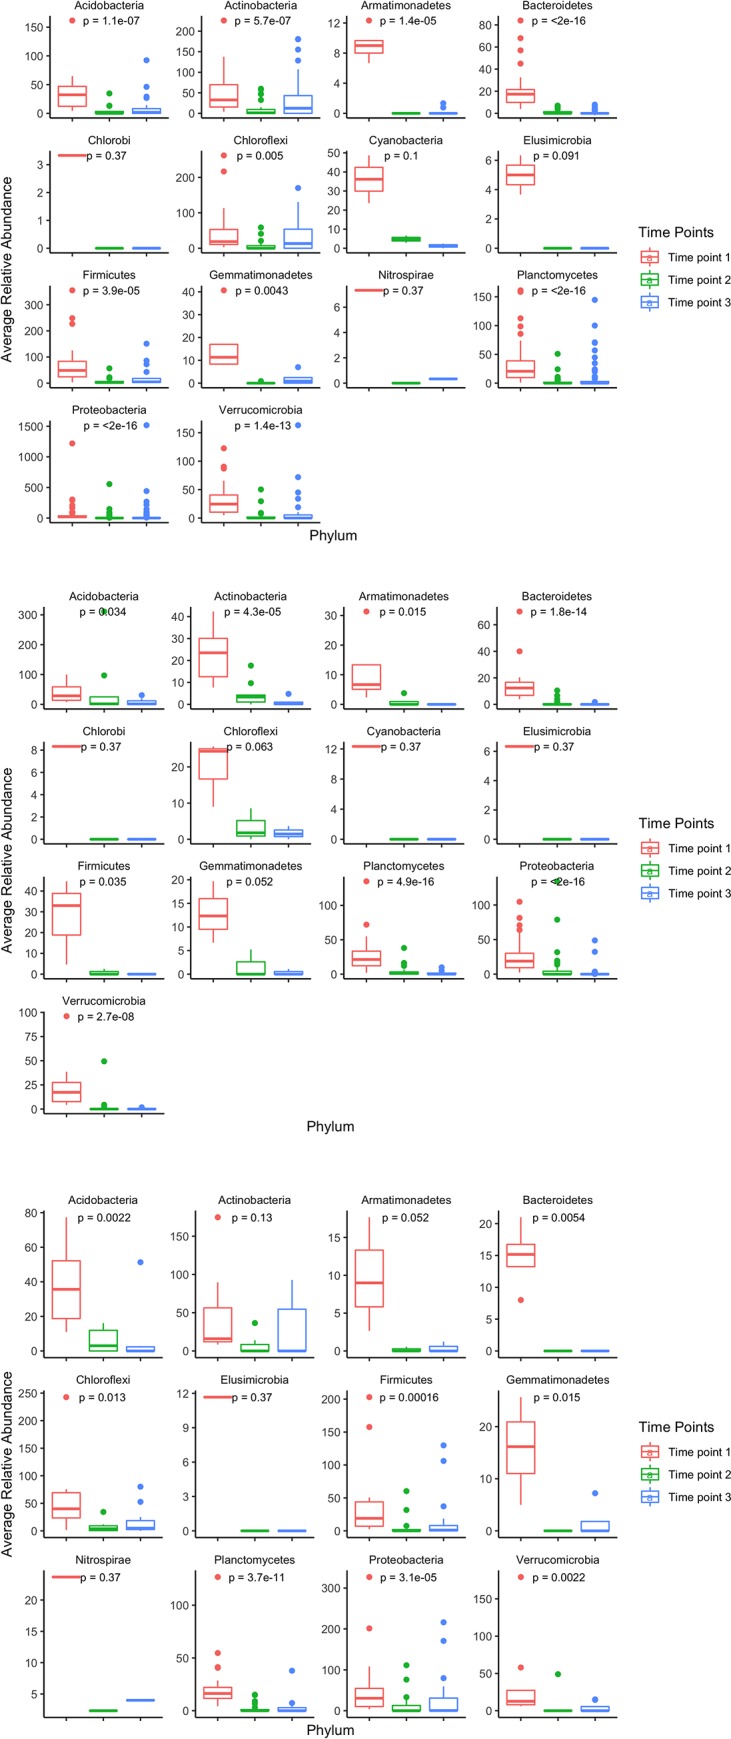
Fig 4. Change in average relative abundance of significantly different ASVs within distinct phyla classifications at all three time points for the three different treatments.

A. For the control treatment, the change in average relative abundance of significantly different bacteria taxa in their relative phyla classifications generally decreased throughout consecutive time points. Out of the 14 classified phyla, 11 demonstrated a significant change in average phyla relative abundance from time point 1 to time point 3. B. For the single-mix treatment, the change in average relative abundance of significantly different bacteria taxa in their relative phyla classifications generally decreased throughout consecutive time points. Out of the 8 classified phyla, 4 demonstrated a significant decrease in average phyla relative abundance between time point 1 and time point 3. C. For the multi-mix treatment, the change in average relative abundance of significantly different bacteria taxa in their relative phyla classifications generally increased throughout consecutive time points. Out of the 10 classified phyla, 5 demonstrated a significant change in average phyla relative abundance from time point 1 to time point 3.
