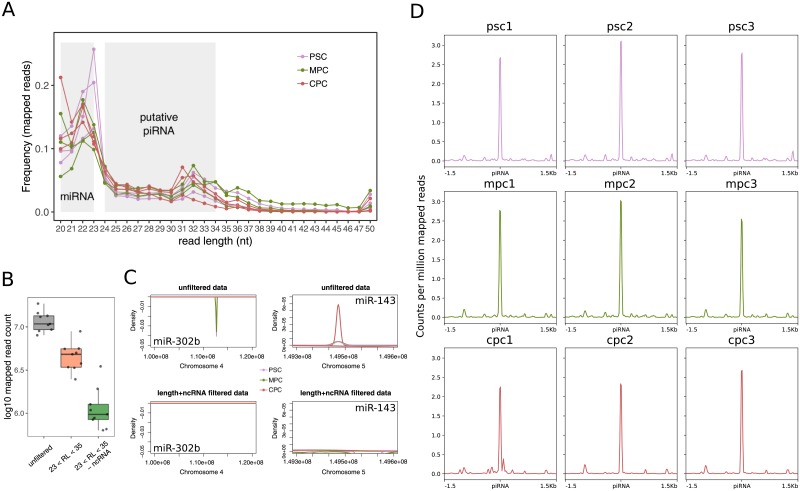
Fig 1. Detection of piRNA transcripts in small RNAseq samples.
A) Length frequency of unfiltered mapped reads in three samples from pluripotent cells (PSC), three from mesoderm progenitor cells (MPC) and three from cardiac cells (CPC). Grey areas denote the size range for both microRNAs (miRNA) and putative piwi-interacting RNAs (piRNA). The color key used is indicated in top right corner of the plot. B) Number of mapped reads for all nine samples before processing (unfiltered, grey box), after filtering by read length (23 < RL < 35, coral box) and removing non coding RNA other than piRNAs (-ncRNA, green box). C) Distribution of mapped reads as a function of density on a fragment of chromosome 4 (chr4:100,000,000–120,000,000; −) which includes pluripotency miR-302b and a fragment of chromosome 5 (chr5:149,300,000–149,600,000, +) including cardiac miR-143 for unprocessed alignments (top panels, unfiltered data) and fully processed samples (bottom panels, length+ncRNA filtered). Alignment files from each experimental replicate were merged into one. Color key for the density curves is shown in the graph. D) Analysis of coverage on all putative piRNA loci available in piRbase for fully processed normalized (counts per million) samples.

