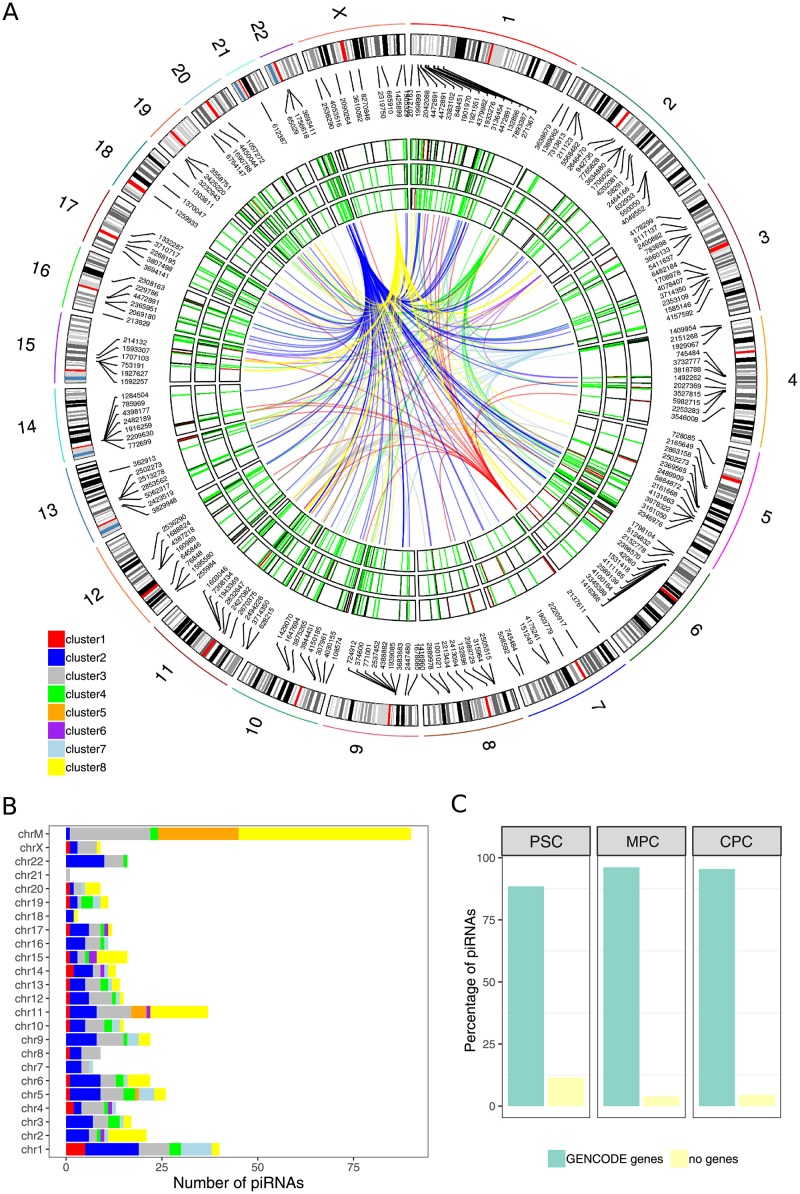
Fig 5. Distribution of piRNA transcripts and expresion clusters in the genome.
A) Normalized expression of piRNA transcripts from averaged samples of PSC (outer track), MPC (middle track) and CPC (inner track) displayed lengthwise in a circular representation of human autosomal chromosomes (1 to 22) and chromosome X. Level of expression is depicted as heatmaps inside the tracks and follow a red-green scale for high expression and low expression respectively. The center of the plot shows links between piRNA transcripts that belong to the same Expression Cluster (EC); color key for the links appears at the bottom left corner of the plot. B) Bars represent number of piRNA expressed in all samples per chromosome. EC membership of piRNAs is indicated with color key as in a (top left corner of barplot). C) Percentage of piRNA transcripts in PSC, MPC and CPC samples that intersected or not with genes from GENCODE database (v29).

