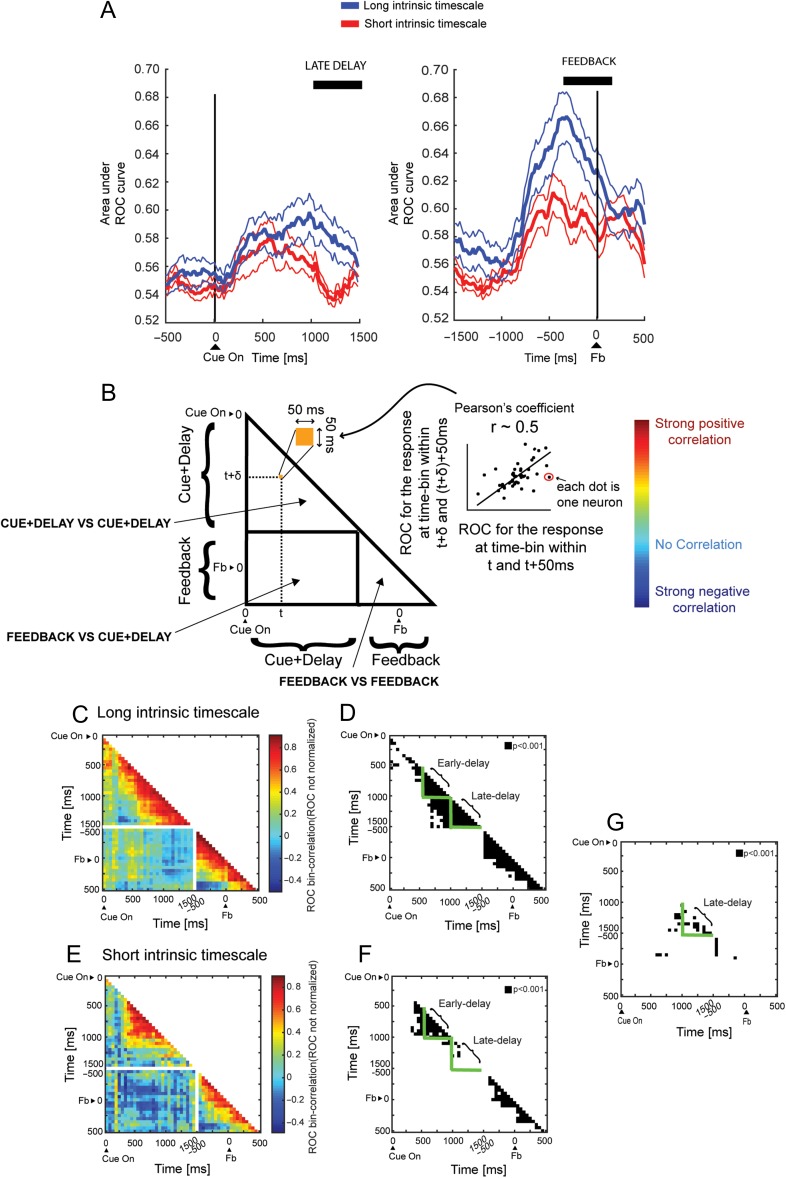
Figure 4.
Intrinsic timescale during fixation predicts neuronal response selectivity in PFdl. (A) Time course of the ROC for the spatial response aligned on the cue (left) and feedback (right) onsets. The population of neurons with long intrinsic timescale (blue line, mean ± SEM) has higher ROC values for the response than those with short intrinsic timescale (red line, mean ± SEM). The black lines indicate a significant difference in the late–delay and feedback periods (Kruskal–Wallis, P < 0.05). (B) Schematic of cross-temporal correlation between ROC values. Each pixel in the triangle is the correlation coefficient between the ROC values computed for 2 time bins for the neuronal population. Sustained population response coding is reflected by high positive correlation, a transient population response is indicated by low correlation, and an inversion of population coding is manifested by negative correlation. (C) Cross-correlation between non-normalized ROC values at time t and t + Δ for PFdl neurons with long intrinsic timescale. Each pixel represents the correlation coefficient between two 50-ms time bins. The population code for the response was maintained for nearly the entire delay but was more transient in the feedback period. (D) Significant P values of each pixel for Pearson’s correlation coefficient in C (black pixel, P < 0.001).The green triangles identify the early–delay and late–delay periods. (E) Cross-correlation between non-normalized ROC values at time t and t + Δ for PFdl neurons with short intrinsic timescale. The population code for the response is inconsistent through the late–delay period. The correlations lose significance in the late–delay period. (F) Significant P-values of each pixel for Pearson’s correlation coefficient in E (black pixel, P < 0.001). The green triangles identify the early–delay and late–delay periods. (G) Comparison between the correlation coefficients at each corresponding pixel (50 ms pixel length) of the short and long timescale populations of Fig 4C,E using Fisher's r-to-z transformation. All pixels with correlation coefficients significantly different between the 2 populations (P < 0.001) are highlighted in black. It is evident that a significant difference emerged in the late–delay period (green triangle), in which the response coding of the neurons with long intrinsic timescale was consistent and sustained to a greater extent than in neurons with short intrinsic timescales.

