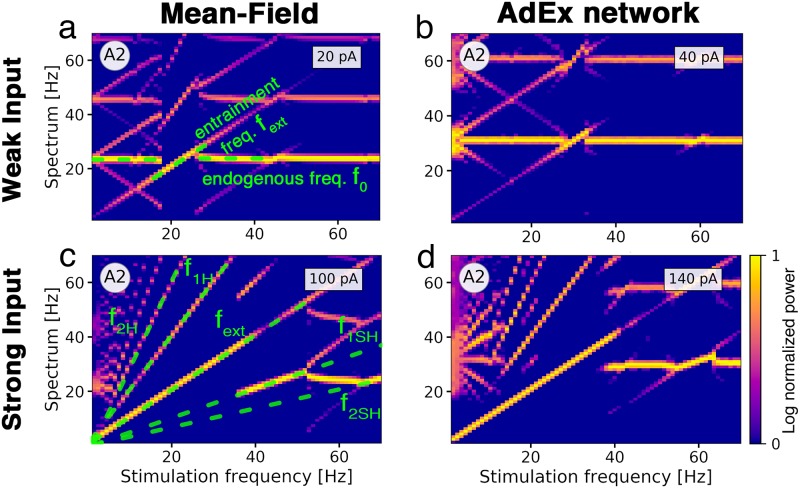
Fig 5. Frequency entrainment of the population activity in response to oscillatory input.
The color represents the log-normalized power of the excitatory population’s rate frequency spectrum with high power in bright yellow and low power in dark purple. (a) Spectrum of the mean-field model parameterized at point A2 with an ongoing oscillation frequency of f0 = 22 Hz (horizontal green dashed line) in response to a stimulus with increasing frequency and an amplitude of 20 pA. An external electric field with a resonant stimulation frequency of f0 has an equivalent strength of 1.5 V/m. The stimulus entrains the oscillation from 18 Hz to 26 Hz, represented by a dashed green diagonal line. At 27 Hz, the oscillation falls back to its original frequency f0. At a stimulation frequency of 2f0, the ongoing oscillation at f0 locks again to the stimulus in a smaller range from 43 Hz to 47 Hz. (b) AdEx network with f0 = 30 Hz. Entrainment with an input current of 40 pA is effective from 27 Hz to 33 Hz. Electric field amplitude with frequency f0 corresponds to 2.5 V/m. (c) Mean-field model with a stimulus amplitude of 100 pA (7.5 V/m at 22 Hz). Green dashed lines mark the driving frequency fext and its first and second harmonics f1H and f2H and subharmonics f1SH and f2SH. Entrainment is effective from the lowest stimulation frequency up to 36 Hz at which the oscillation falls back to a frequency of 20 Hz. New diagonal lines appear due to interactions of the endogenous oscillation with the entrained harmonics and subharmonics. (d) AdEx network with stimulation amplitude of 140 pA (8.75 V/m at 30 Hz). For the AdEx network, N = 20 × 103. All parameters are given in Tables 1 and 2.

