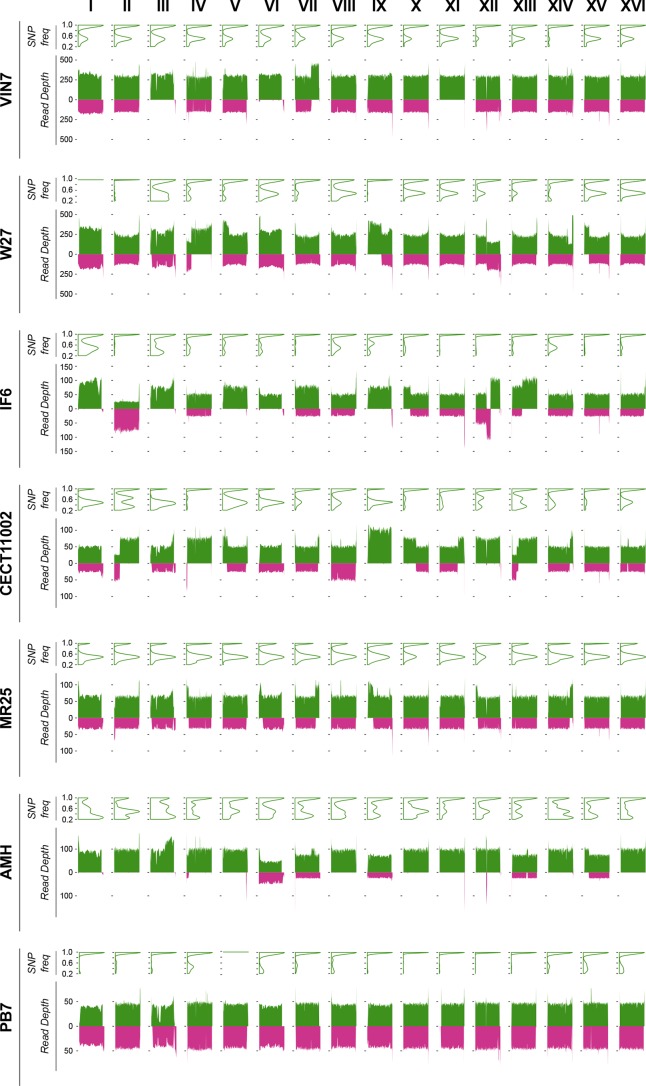
Fig. 2.
Genome composition of the strains. For each strain, we represent (up) the SNP frequency-density distribution in Sc subgenome and (down) the RD for each chromosome. The SNP frequencies are represented in the y-axis and the density is represented for the whole chromosome in the Sc subgenome (SNP distribution along the chromosome is shown in Fig. S5). Most of the chromosomes show two peaks, one around 1 that are homozygous SNPs, and a second one around 0.5, heterozygous SNPs in the strains that have two Sc copies. This distribution changes according to the ploidy or presence of aneuploidies. RD is represented for 10 kb windows moving by 1000 nt. The Sc subgenome is coloured in green and Sk subgenome in purple.

